已更新
Dynamic RTH Gap [Pro+] (TheEngineer)
Description:
Elevate your trading expertise with the Dynamic RTH Gap [Pro+], specifically designed for day traders and intraday analysts. Built to serve functionality, it enables traders to dissect and leverage Regular Trading Hour gaps with unparalleled precision and customization. This tool is built based on the methods and experience of TheEngineer who has refined these concepts over Time, creating a stronger framework for intraday analysis.
The difference between the price at market close and the open price at market open defines the RTH gap. These Times vary across different markets and countries, for example for US markets, the gap is defined between 16:15 and 9:30 of the following day.
In futures contracts, traders can use Electronic Trading Hours (ETH), or Regular Trading Hours (RTH). ETH includes the overnight session and pre-market, where majority of market participants are inactive.
When the new day RTH Opens, the Inner Circle Trader teaches how influential the gap created from the previous day's close and the next day's open is to futures contract analysis. Using RTH gap midpoints and projections can aid day traders in interpreting price action with higher context, contributing to higher probability ideas.
Key Features:
These tools are available ONLY on the TradingView platform.
Terms and Conditions
Elevate your trading expertise with the Dynamic RTH Gap [Pro+], specifically designed for day traders and intraday analysts. Built to serve functionality, it enables traders to dissect and leverage Regular Trading Hour gaps with unparalleled precision and customization. This tool is built based on the methods and experience of TheEngineer who has refined these concepts over Time, creating a stronger framework for intraday analysis.
The difference between the price at market close and the open price at market open defines the RTH gap. These Times vary across different markets and countries, for example for US markets, the gap is defined between 16:15 and 9:30 of the following day.
In futures contracts, traders can use Electronic Trading Hours (ETH), or Regular Trading Hours (RTH). ETH includes the overnight session and pre-market, where majority of market participants are inactive.
When the new day RTH Opens, the Inner Circle Trader teaches how influential the gap created from the previous day's close and the next day's open is to futures contract analysis. Using RTH gap midpoints and projections can aid day traders in interpreting price action with higher context, contributing to higher probability ideas.
Key Features:
- Selective Day Analysis: Optimize your trading strategy and templates by focusing on specific days of the week. This tool provides checkboxes for Monday through Friday, allowing for granular analysis on the days that matter most to your trading regimen.
Tuesday Gap extended throughout the week serves as a compass and, in this case, supports price: - RTH Gap Visualization: Engage with the markets through a dynamic visual display of RTH gaps. Benefit from our 'Show RTH Gap' option with an 'Auto Color' feature that automatically adjusts to reflect the bullish or bearish significance of the gap, enhancing your chart analysis with an intuitive color scheme.
- Historical CE: This feature is a dedicated component of the Dynamic RTH Gap [Pro+] that integrates the concept of Consequent Encroachment (CE) from the ICT Inner Circle Trader methodology. CE is noted as the 50% of the RTH Gap. Historical CEs may act as key market pivots and or display imbalances away from such level.
- Gap Grades Flexibility: Choose from various styles such as 'Dashed', 'Solid', or 'Dotted' to categorize gap grades. An additional option to 'Show Quarters' divides the Regular Trading Hours Gap into quarters for more detailed analysis.
- Proactive Gap Projections: Activate 'Show Projections' to display standard deviations of the Regular Trading Hours Gap with an 'Auto' or manual setting. This is complimented with a a visual selection for projection style, providing clearer lines per Tradingview layouts.
- Projection Gap Threshold: The 'Proj. Gap Threshold' slider is an innovative feature within the Dynamic RTH Gap [Pro+], designed to empower traders’ control for gap projections. This feature allows one to display larger or smaller gaps to their back tested values.
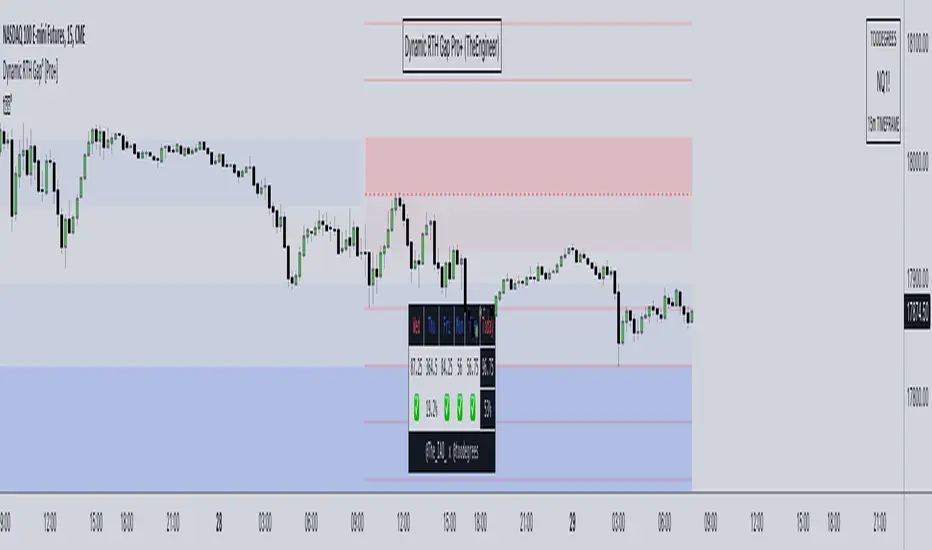
Smaller RTH Gaps are less insightful, notice this small gap's projections being hit in the first few candles after the gap is established: - Data Table Integration: With the 'Show Data Table' toggle, access a neatly organized table that compiles and presents relevant gap data. Enhance your data analysis with 'Color Coding', distinguishing data points for quick identification and comparison. Lastly, monitor the % fill of the RTH gaps, up to five gaps in the past.
- Automated Gap and Deviation Alerts: This tool is equipped with real-time alerts for immediate notification when gaps fill or when specific deviation levels are reached. Tailor your alerts to your strategy, and stay informed with minimizing chart time. With this feature, traders can maintain a competitive edge on multiple instruments by setting alerts, providing additional trading opportunities.
These tools are available ONLY on the TradingView platform.
Terms and Conditions
- Our charting tools are products provided for informational and educational purposes only and do not constitute financial, investment, or trading advice. Our charting tools are not designed to predict market movements or provide specific recommendations. Users should be aware that past performance is not indicative of future results and should not be relied upon for making financial decisions. By using our charting tools, the purchaser agrees that the seller and the creator are not responsible for any decisions made based on the information provided by these charting tools. The purchaser assumes full responsibility and liability for any actions taken and the consequences thereof, including any loss of money or investments that may occur as a result of using these products. Hence, by purchasing these charting tools, the customer accepts and acknowledges that the seller and the creator are not liable nor responsible for any unwanted outcome that arises from the development, the sale, or the use of these products. Finally, the purchaser indemnifies the seller from any and all liability. If the purchaser was invited through the Friends and Family Program, they acknowledge that the provided discount code only applies to the first initial purchase of the Toodegrees Premium Suite subscription. The purchaser is therefore responsible for cancelling – or requesting to cancel – their subscription in the event that they do not wish to continue using the product at full retail price. If the purchaser no longer wishes to use the products, they must unsubscribe from the membership service, if applicable. We hold no reimbursement, refund, or chargeback policy. Once these Terms and Conditions are accepted by the Customer, before purchase, no reimbursements, refunds or chargebacks will be provided under any circumstances.
- By continuing to use these charting tools, the user acknowledges and agrees to the Terms and Conditions outlined in this legal disclaimer.
發行說明
Alert Bug Fixes發行說明
To see the updated version, remove and re-add the tool to your chart.New Features:
- Added RTH Gap for stocks!
- Better Customization for CE and Quadrants
Improvements:
- Gap now plots further out, allowing it to be seen right away once established
- Better Alerts system, now reports the day/date of the filled RTH Gap
發行說明
To see the updated version, remove and re-add the tool to your chart. Bug Fix:
- % of Gap Fills was 0% after latest update – fixed
發行說明
To see the updated version, remove and re-add the tool to your chart.- Alerts for Gap Fill, Quarters, and CE
- Enhanced Color Options
- Customizable Projection Labels
- ETH Candles Visibility and Customization
- More MTF Data for Backtesting
- Historical RTH Gap Projections
- Better Projection Threshold Settings
發行說明
New Features:- Developing RTH gap visualization
- Custom projection levels
Bug Fixes:
- Fixed data table bugs for DOW & gap fill
- ETH candles draw on top of price automatically
發行說明
Minor Changes發行說明
Big Fix- Developing Gap Runtime Error [Array Index Out Of Bounds]
- Developing Gap Fill % replaced with "-"
可在付費空間使用
此指標僅對Toodegrees Elite Collection訂閱用戶開放。加入訂閱即可訪問此指標以及toodegrees的其他腳本。
homo faber fortunæ suæ
免責聲明
這些資訊和出版物並非旨在提供,也不構成TradingView提供或認可的任何形式的財務、投資、交易或其他類型的建議或推薦。請閱讀使用條款以了解更多資訊。
可在付費空間使用
此指標僅對Toodegrees Elite Collection訂閱用戶開放。加入訂閱即可訪問此指標以及toodegrees的其他腳本。
homo faber fortunæ suæ
免責聲明
這些資訊和出版物並非旨在提供,也不構成TradingView提供或認可的任何形式的財務、投資、交易或其他類型的建議或推薦。請閱讀使用條款以了解更多資訊。