PROTECTED SOURCE SCRIPT
已更新 52SIGNAL RECIPE Directional Consistency Index
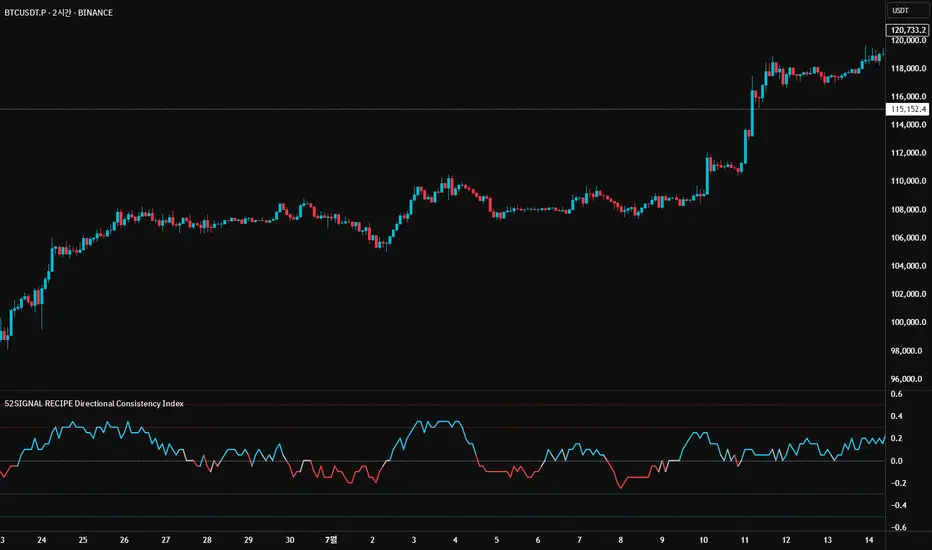
═══ 52SIGNAL RECIPE Directional Consistency Index (DCI) ═══
◆ Overview
52SIGNAL Directional Consistency Index (DCI) is a technical indicator that measures the directional consistency of market movements. This indicator focuses on the consistency of direction rather than the magnitude of price changes, analyzing the strength of market trends and providing more reliable trend analysis by filtering out noise to reflect only meaningful price movements.
─────────────────────────────────────
◆ Key Features
• Direction-Focused Analysis: Concentrates solely on directional consistency rather than magnitude of price changes
• Noise Filtering: Ignores insignificant price movements through minimum percentage change settings
• Trend Exhaustion Detection: Identifies potential trend reversals as values approach ±0.5 levels
• Intuitive Visualization: Instant recognition of trend direction through color changes based on rising/falling zones
• Multi-Market Application: Adaptable to various financial markets including stocks, cryptocurrencies, and forex
─────────────────────────────────────
◆ Technical Foundation
■ Directional Calculation
• Basic Principle: Counts only the up/down movement of each candle to measure directional consistency
• Calculation Method: Determines direction based on percentage change between current close and previous close
• Direction Values: Simplified into Rising (+1), Falling (-1), or Insignificant Change (0)
• Averaging: DCI calculated as the moving average of direction values over the specified period
■ Noise Filtering Mechanism
• Minimum Percentage Change: The minimum percent change required to consider a price movement significant
• Filtering Effect: Movements smaller than the minimum change are excluded from direction calculation (treated as 0)
• Enhanced Reliability: Adjustable filtering strength for optimization across different market environments
─────────────────────────────────────
◆ Practical Applications
■ Trend Identification & Reversal Prediction
• Early Uptrend Detection:
▶ When DCI enters the 0 to +0.3 range
▶ When recent directional consistency begins to consistently rise
• Early Downtrend Detection:
▶ When DCI enters the 0 to -0.3 range
▶ When recent directional consistency begins to consistently fall
• Trend Reversal Signals:
▶ When DCI approaches +0.5 (uptrend exhaustion, potential downward reversal)
▶ When DCI approaches -0.5 (downtrend exhaustion, potential upward reversal)
■ Trading Strategy Implementation
• Trend Following Strategies:
▶ Consider buying when DCI crosses above the 0 line
▶ Consider selling when DCI crosses below the 0 line
• Reversal Trading:
▶ Consider taking profits or short positions when DCI approaches +0.5
▶ Consider long positions when DCI approaches -0.5
• Divergence Confirmation:
▶ Weakening uptrend signal when price rises but DCI weakens
▶ Weakening downtrend signal when price falls but DCI strengthens
─────────────────────────────────────
◆ Advanced Setting Options
■ Period (Length) Settings
• Short-term Analysis: 5-10 days (faster signals, more sensitive responses)
• Medium-term Analysis: 10-20 days (balanced signals, recommended default)
• Long-term Analysis: 20-30 days (slower signals, long-term trend identification)
■ Minimum Percentage Change Settings
• Low Volatility Markets: 0.05-0.2% (suitable for forex markets)
• Medium Volatility Markets: 0.3-0.5% (suitable for stock markets)
• High Volatility Markets: 0.5-1.0% (suitable for cryptocurrency markets)
■ Settings by Trading Style
• Scalping: Lower period (5-10), lower minimum change (0.05-0.1%)
• Day Trading: Medium period (10-15), medium minimum change (0.2-0.3%)
• Swing Trading: Higher period (15-25), higher minimum change (0.3-0.5%)
─────────────────────────────────────
◆ Synergy with Other Indicators
• Moving Averages: Strengthen signals by confirming moving average crossovers when DCI crosses the 0 line
• RSI: Combine DCI trend direction with RSI overbought/oversold levels to confirm entry points
• MACD: Enhance reliability by pairing DCI directional signals with MACD momentum confirmation
• Bollinger Bands: Analyze volatility by checking Bollinger Band expansion/contraction when DCI approaches ±0.5
─────────────────────────────────────
◆ Conclusion
52SIGNAL Directional Consistency Index (DCI) is a powerful tool for objectively measuring market directionality and visualizing trend strength. The noise filtering through minimum percentage change settings can be adjusted to match your trading style and market characteristics for optimal results. Its ability to identify early trend stages and detect overextended zones provides traders with important entry and exit points. When used in conjunction with other technical indicators, it can significantly enhance the reliability of trading decisions.
─────────────────────────────────────
※ Disclaimer: Past performance does not guarantee future results. Always use appropriate risk management strategies.
═══ 52SIGNAL 방향성 일관성 지수 (DCI) ═══
◆ 개요
52SIGNAL 방향성 일관성 지수(DCI)는 시장의 방향성 일관성을 측정하는 기술적 지표입니다. 이 지표는 가격 변화의 크기가 아닌 방향의 일관성에 중점을 두어 시장의 추세 강도를 분석하고, 노이즈 필터링 기능을 통해 의미 있는 가격 변동만을 반영하여 더 신뢰할 수 있는 추세 분석을 제공합니다.
─────────────────────────────────────
◆ 주요 특징
• 방향성 중심 분석: 가격 변화의 크기가 아닌 방향성에만 집중하여 추세의 일관성 측정
• 노이즈 필터링: 최소 변화율 설정을 통해 의미 없는 작은 가격 변동을 무시
• 추세 과열 감지: ±0.5 수준에 접근할 때 추세 전환 가능성 식별
• 직관적인 시각화: 상승/하락 구간에 따른 색상 변화로 추세 방향 즉각 인식
• 다양한 시장 적용: 주식, 암호화폐, 외환 등 다양한 금융 시장에 적용 가능
─────────────────────────────────────
◆ 기술적 기반
■ 방향성 계산
• 기본 원리: 각 캔들의 상승/하락 여부만 카운트하여 방향의 일관성 측정
• 계산 방법: 현재 종가와 이전 종가의 퍼센트 변화를 기준으로 방향 판단
• 방향 값: 상승(+1), 하락(-1), 의미 없는 변화(0)로 단순화
• 평균화: 설정된 기간 동안의 방향 값의 이동평균으로 DCI 산출
■ 노이즈 필터링 메커니즘
• 최소 변화율: 의미 있는 가격 변동으로 인정할 최소 퍼센트 변화
• 필터링 효과: 최소 변화율보다 작은 변동은 방향 계산에서 제외(0으로 처리)
• 신뢰도 향상: 필터링 강도 조절을 통해 다양한 시장 환경에 최적화 가능
─────────────────────────────────────
◆ 실용적 응용
■ 추세 식별 및 전환점 예측
• 상승 추세 초입:
▶ DCI가 0에서 +0.3 사이로 진입할 때
▶ 최근 방향성이 일관되게 상승하기 시작할 때
• 하락 추세 초입:
▶ DCI가 0에서 -0.3 사이로 진입할 때
▶ 최근 방향성이 일관되게 하락하기 시작할 때
• 추세 전환 신호:
▶ DCI가 +0.5에 가까워질 때 (상승 추세 과열, 하락 전환 가능성)
▶ DCI가 -0.5에 가까워질 때 (하락 추세 과열, 상승 전환 가능성)
■ 트레이딩 전략 적용
• 추세 추종 전략:
▶ DCI가 0선을 위로 돌파할 때 매수 고려
▶ DCI가 0선을 아래로 돌파할 때 매도 고려
• 반전 트레이딩:
▶ DCI가 +0.5에 근접할 때 이익실현 또는 매도 포지션 고려
▶ DCI가 -0.5에 근접할 때 매수 포지션 고려
• 다이버전스 확인:
▶ 가격은 상승하나 DCI가 약화될 때 상승 추세 약화 신호
▶ 가격은 하락하나 DCI가 강화될 때 하락 추세 약화 신호
─────────────────────────────────────
◆ 고급 설정 옵션
■ 기간(Length) 설정
• 단기 분석: 5-10일 (빠른 신호, 민감한 반응)
• 중기 분석: 10-20일 (균형 잡힌 신호, 기본 권장)
• 장기 분석: 20-30일 (느린 신호, 장기 추세 식별)
■ 최소 변화율(Minimum % Change) 설정
• 저변동성 시장: 0.05-0.2% (외환 시장에 적합)
• 중변동성 시장: 0.3-0.5% (주식 시장에 적합)
• 고변동성 시장: 0.5-1.0% (암호화폐 시장에 적합)
■ 트레이딩 스타일별 설정
• 스캘핑: 낮은 기간(5-10), 낮은 최소 변화율(0.05-0.1%)
• 데이 트레이딩: 중간 기간(10-15), 중간 최소 변화율(0.2-0.3%)
• 스윙 트레이딩: 높은 기간(15-25), 높은 최소 변화율(0.3-0.5%)
─────────────────────────────────────
◆ 다른 지표와의 시너지
• 이동평균선: DCI가 0선을 돌파할 때 이동평균 교차 확인으로 신호 강화
• RSI: DCI의 추세 방향과 RSI의 과매수/과매도 수준을 결합하여 진입점 확인
• MACD: DCI의 방향성 신호와 MACD의 모멘텀 확인을 결합하여 신뢰도 향상
• 볼린저 밴드: DCI가 ±0.5에 근접할 때 볼린저 밴드 확장/수축 확인으로 변동성 분석
─────────────────────────────────────
◆ 결론
52SIGNAL 방향성 일관성 지수(DCI)는 시장의 방향성을 객관적으로 측정하고 추세의 강도를 시각화하는 강력한 도구입니다. 최소 변화율 설정을 통한 노이즈 필터링은 각자의 트레이딩 성향과 시장 특성에 맞게 조정할 수 있어 최적의 효과를 누릴 수 있습니다. 추세의 초기 단계를 식별하고 과열 구간을 감지하는 능력은 트레이더에게 중요한 진입 및 퇴출 포인트를 제공합니다. 다른 기술적 지표와 함께 사용하면 트레이딩 결정의 신뢰도를 크게 향상시킬 수 있습니다.
─────────────────────────────────────
※ 면책 조항: 과거 성과가 미래 결과를 보장하지 않습니다. 항상 적절한 리스크 관리 전략을 사용하세요.
發行說明
Feature update complete受保護腳本
此腳本以閉源形式發佈。 不過,您可以自由使用,沒有任何限制 — 點擊此處了解更多。
Recipe your trading with 52SIGNAL.
No more repainting tricks, fake backtesting data, or unrealistic returns.
No more repainting tricks, fake backtesting data, or unrealistic returns.
免責聲明
這些資訊和出版物並非旨在提供,也不構成TradingView提供或認可的任何形式的財務、投資、交易或其他類型的建議或推薦。請閱讀使用條款以了解更多資訊。
受保護腳本
此腳本以閉源形式發佈。 不過,您可以自由使用,沒有任何限制 — 點擊此處了解更多。
Recipe your trading with 52SIGNAL.
No more repainting tricks, fake backtesting data, or unrealistic returns.
No more repainting tricks, fake backtesting data, or unrealistic returns.
免責聲明
這些資訊和出版物並非旨在提供,也不構成TradingView提供或認可的任何形式的財務、投資、交易或其他類型的建議或推薦。請閱讀使用條款以了解更多資訊。