PROTECTED SOURCE SCRIPT
[FRK] Dual Timeline - Separate Pane
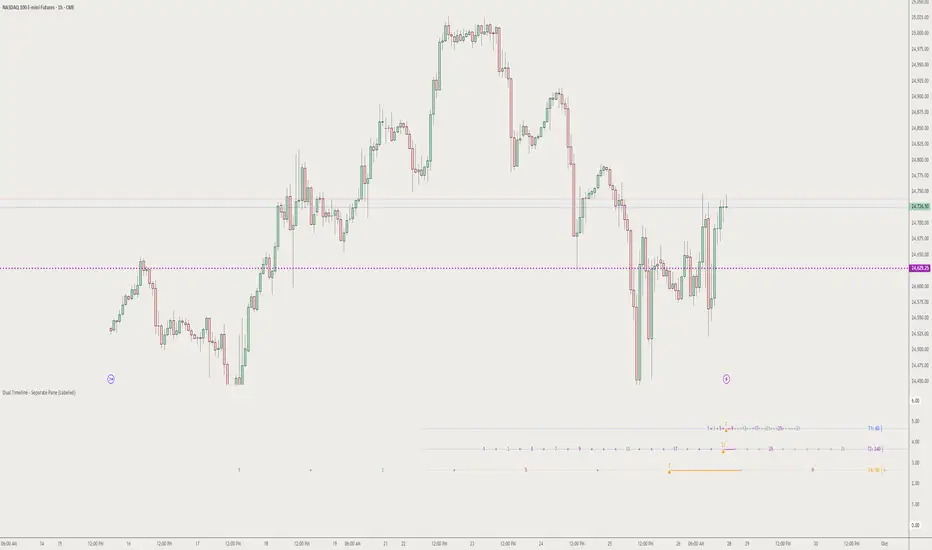
The Dual Timeline - Separate Pane indicator is a sophisticated multi-timeframe analysis tool that tracks and displays up to 4 different timeline counts simultaneously in a dedicated pane below your chart. This indicator is designed for traders who use Time-Based Trading (TDT) strategies and need precise tracking of candle/bar counts across multiple timeframes.
Key Features
🔢 Multi-Timeline Tracking:
• Timeline 1: Current chart timeframe counting
• Timeline 2: Customizable higher timeframe (HTF) with proper boundary alignment
• Timeline 3: Specialized 90-minute cycle counting aligned to 2:30 AM NY time
• Timeline 4: Advanced HTF counting with special handling for daily/weekly timeframes
🎯 Strategic Milestone Display:
• Tracks key milestone numbers: 1, 3, 5, 7, 9, 13, 17, 21, 25, 31
• Color-coded sequences for TDT strategies:
◦ Green: Primary sequence (3, 7, 13, 21)
◦ Purple: Secondary sequence (5, 9, 17, 25)
◦ Orange: Current position markers
◦ Gray: Future projections
⚙️ Advanced Customization:
• Individual milestone visibility controls
• Quick presets for TDT strategies:
◦ Top 3 performers (1, 3, 13, 17, 21)
◦ TDT Primary sequence (1, 3, 7, 13, 21)
◦ TDT Secondary sequence (1, 5, 9, 17, 25)
• Customizable colors and font sizes
• Timeline enable/disable controls
📊 Professional Visual Layout:
• Clean separate pane display with labeled timelines
• Subtle center lines for easy reading
• Current position arrows (▲) for active counts
• Connecting lines from latest milestones
• Dots for non-milestone positions
• Future projection capabilities
Special Features
Time-Based Alignment:
• Daily/Weekly timeframes align to 6:00 PM NY (Asia market open)
• Custom 4-hour boundaries: 10:00, 14:00, 18:00, 22:00, 02:00, 06:00
• 90-minute cycles precisely aligned to 2:30 AM NY base time
• HTF boundary detection for accurate positioning
Smart Positioning:
• Time-based positioning for gap handling
• Extended visibility range (1000+ bars back, 500+ bars forward)
• Automatic bar position calculation
• Cross-timeframe synchronization
Use Cases
1. TDT Strategy Implementation: Perfect for Time-Based Trading strategies that rely on specific count sequences
2. Multi-Timeframe Analysis: Track multiple timeframes simultaneously without switching charts
3. Cycle Analysis: Specialized 90-minute cycle tracking for intraday strategies
4. Milestone Targeting: Visual identification of key support/resistance levels based on time counts
5. Future Planning: Project upcoming milestone levels for trade planning
Settings Groups
• Timeline 1-4: Individual start times and timeframe selections
• Display: Colors, fonts, and visual preferences
• Milestone Visibility: Granular control over which counts to display
• Quick Presets: One-click strategy templates
Data Window Output
The indicator provides detailed count information in the data window for precise analysis and strategy backtesting.
Perfect for traders using:
• Time-based trading strategies
• Multi-timeframe analysis
• Cycle-based approaches
• Milestone targeting systems
• Advanced chart timing techniques
This indicator transforms complex multi-timeframe counting into an intuitive visual tool, making it easier to spot patterns, time entries, and plan exits across multiple time dimensions simultaneously.
受保護腳本
此腳本以閉源形式發佈。 不過,您可以自由使用,沒有任何限制 — 點擊此處了解更多。
免責聲明
這些資訊和出版物並非旨在提供,也不構成TradingView提供或認可的任何形式的財務、投資、交易或其他類型的建議或推薦。請閱讀使用條款以了解更多資訊。
免責聲明
這些資訊和出版物並非旨在提供,也不構成TradingView提供或認可的任何形式的財務、投資、交易或其他類型的建議或推薦。請閱讀使用條款以了解更多資訊。