PROTECTED SOURCE SCRIPT
RSI ADX D-Line
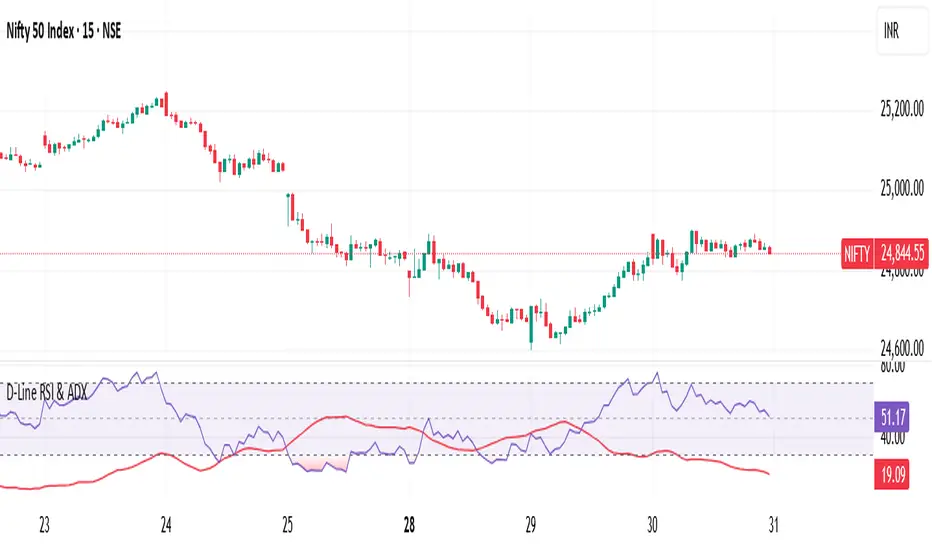
The D-Line RSI & ADX indicator combines the Relative Strength Index (RSI) with the Average Directional Index (ADX) to provide traders with a dual perspective on market momentum and trend strength. The RSI (purple line) measures the speed and change of price movements, helping traders identify overbought and oversold conditions. The ADX (red line) gauges the strength of the prevailing trend, assisting traders in filtering out ranging markets and focusing only on strong trends.
This indicator is designed to work on all timeframes and instruments. It helps traders confirm signals: for example, look for entries when RSI shows potential reversals while the ADX confirms the trend’s strength.
Key Features:
Clear RSI and ADX visualization on a single pane
Easily spot trend continuation or reversal setups
Suitable for intraday, swing, or positional trading
How to Use:
When RSI crosses above 70 or below 30, watch for potential reversals.
When ADX is above 20-25, it signals a strong trend; below indicates a weak or ranging market.
Combine RSI overbought/oversold levels with ADX trend confirmation for higher probability trades.
Ideal For:
Traders who want to enhance their decision-making with momentum and trend strength confirmation in one tool.
受保護腳本
此腳本以閉源形式發佈。 不過,您可以自由使用,沒有任何限制 — 點擊此處了解更多。
免責聲明
這些資訊和出版物並非旨在提供,也不構成TradingView提供或認可的任何形式的財務、投資、交易或其他類型的建議或推薦。請閱讀使用條款以了解更多資訊。
受保護腳本
此腳本以閉源形式發佈。 不過,您可以自由使用,沒有任何限制 — 點擊此處了解更多。
免責聲明
這些資訊和出版物並非旨在提供,也不構成TradingView提供或認可的任何形式的財務、投資、交易或其他類型的建議或推薦。請閱讀使用條款以了解更多資訊。