OPEN-SOURCE SCRIPT
Hancock - Floating O/B O/S IFT RSI T3MA
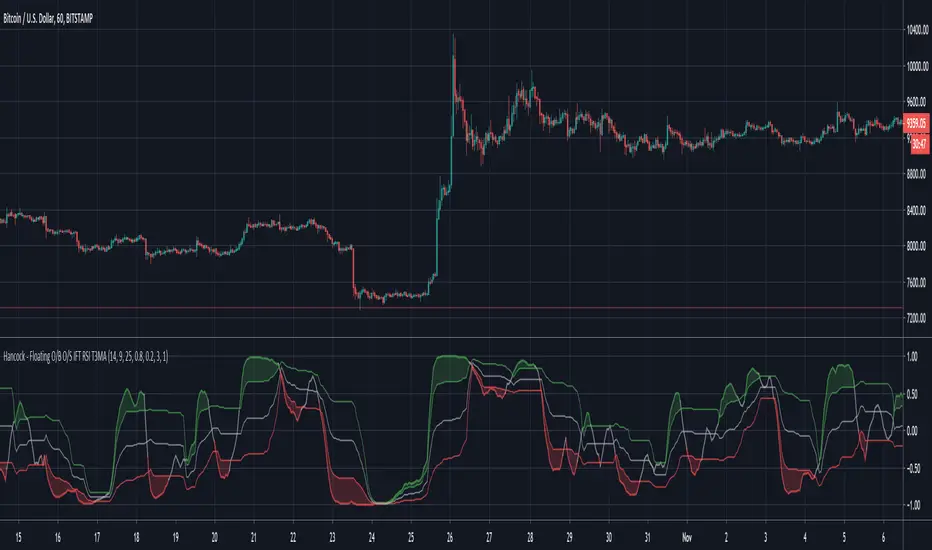
This is a version of the Inverse Fisher Transform Relative Strength Index with floating oversold and overbought thresholds.
Configurable parameters:
RSI length - This is the period used for the RSI .
RSI Smooth Length - This is the smoothing period of the Weighted Moving Average used for the smoothing in Inverse Fisher Transform .
RSI Threshold Period - This is the period used for calculating the floating oversold and overbought thresholds.
RSI Overbought - Configures the overbought threshold (80% default).
RSI Oversold - Configures the oversold threshold (20% default).
T3 Smoothing - Enabling this applies T3MA smoothing to the RSI.
T3 Length - This is the period used for the T3MA smoothing of the RSI.
T3 Factor - This is the factor used for the T3MA smoothing of the RSI.
RSI line breaching the thresholds are clearly indicated by filled chart plots.
An inverse Fisher transform of RSI is designed to enhance the extremes (overbought and oversold zones), in combination with floating thresholds this version allows faster and cleaner trend detection and identification. With additional smoothing, false signals can be avoided. As with any other indicator some experimenting with parameters is advised (in order to find optimal settings for symbol/time frame pair).
Happy trading folks!
Hancock
開源腳本
秉持TradingView一貫精神,這個腳本的創作者將其設為開源,以便交易者檢視並驗證其功能。向作者致敬!您可以免費使用此腳本,但請注意,重新發佈代碼需遵守我們的社群規範。
免責聲明
這些資訊和出版物並非旨在提供,也不構成TradingView提供或認可的任何形式的財務、投資、交易或其他類型的建議或推薦。請閱讀使用條款以了解更多資訊。
免責聲明
這些資訊和出版物並非旨在提供,也不構成TradingView提供或認可的任何形式的財務、投資、交易或其他類型的建議或推薦。請閱讀使用條款以了解更多資訊。