INVITE-ONLY SCRIPT
已更新 TrendShikari NTS - Strategy
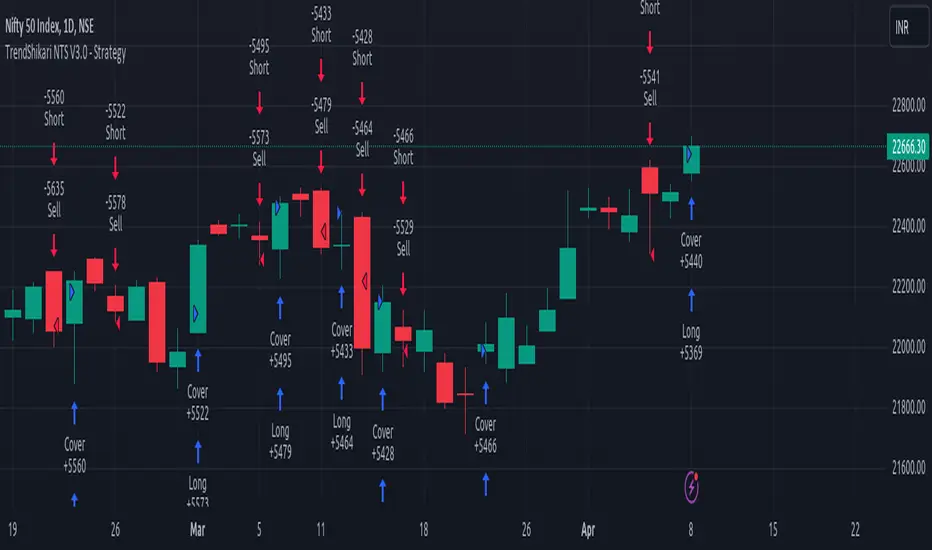
TrendShikari NTS is a Nifty Index, Swing trading system with great profitability. This is the STRATEGY file for you to see backtest performance along with the feature to see the next day trading levels in advance. For getting Email / SMA alerts (based on your TV subscription plan) and to see better graphic level marking use the STUDY file from the indicator library. Access to this system will be limited. See my profile status field to see how you can gain access.
Salient Features
1. Daily Bar System. System analyzes a Daily chart of NIFTY to give signals with average holding period of 5 days.
2. Automatic Long and Short signal generation. No need to draw waves / lines and other fancy stuff on your charts to analyze NIFTY any more.
3. Backtester Results Available - Thanks to TradingView, backtest results for previous years (from 1990) are available right in the charting platform for NIFTY.
Having a good trading system is one thing and trading it to make money is a whole different ball game. One thing you must always do if you want to mimic the backtest results in live trading is to follow the rules mentioned below as if your life depends on it.
Trading Rules
1. Each day the system gives you a Long and Short trading level. You go Long on NIFTY when the Daily Long level is breached and you go Short on NIFTY when the Daily Short Level is breached.
2. Trade using Nifty Options, In the Money calls, one strike below the nearest strike price for going Long using Call Option or one strike above the nearest strike price for going Short using Put Option.
3. Preset exit and entry orders of appropriate option contracts every day at market open. To set the levels see the difference in Nifty spot price and the trading levels given by system and then multiply it with 0.8 to give an approximate order trigger price in both directions for the corresponding option contracts.
4. Book profit when Nifty moves significantly along signal direction. Every time NIFTY moves 100 points in your direction you exit the current option contract and enter a trade in the next strike price in the same direction.
5. Rollover before expiry. Its important that you rollover (ideally one day before the expiry day) your Option contact positions by exiting the current month contract and take a new position in the next month contract of the same type and strike price of the current month contract.
6. Trade only Nifty using this system. Also Daily chart has to be used for trading. System parameters have been tested and optimized for Nifty Index Daily patterns only and hence is likely to give stated results with Nifty Daily chart only.
7. Trade all signals. Don't pick and choose or add your own or someone else's analysis to filter the signals. Take confidence from the objective backtest results and not any subjective interpretations.
8. Trade with only that amount of money you can afford to loose. Initial capital that you need to have to trade one lot of NIFTY Option using this system should be at least INR 150000. You need only INR 7500 - 15000 to open a position and the rest is the margin of safety you need to have in your trading account to account for drawdowns in trading. You can add the capital in a staggered need to basis to your trading account. But make sure you have the initial capital mentioned above at your disposal, if need be.
As always your thoughts and inputs are welcome. Happy Trading !!!
發行說明
Hi AllExcited to update the existing script with more features. Here is a list of changes
1. Updated to Pine Version 4
2. Improved algorithm for even better performance
3. Better graphics using latest Pine features]
Happy Trading
Syam
發行說明
Published image was bit cluttered. So publishing again with only the current script loaded. 發行說明
Release Notes: New Release V2.1. The change list is given below.1. User control for displaying ITM option prices close to daily long and short levels have been added. By default, the ITM option prices won't be displayed. It is important to understand that this is a Nifty Index analysis tool only. The instrument you want to trade based on the tool analysis is up to you. Me or my company don't recommend to buy or sell any financial instrument. However, the basic set of rules I use to trade using the tool and the logic I use to select the instrument I trade is published on the company website. It is for your reference only and is by no means a recommendation to buy or sell.
2. Strategy file shows next day levels. This is now clearly marked in the labels. The labels will disappear when a new real-time bar starts. So use the labels from study file when market is live.
Note: There are some rare days when the daily real-time candle hits both green and red lines. However, the strategy backtester may place only one order per day even on dual signal days. This is because the backester uses a broker emulator as published here. The base method to analyze the system is this - when the real-time bar hits the green line Nifty is likely to trend up and if it hits the red line it's likely to trend down, even if this happens intraday.
發行說明
Following changes were made in revision 2.21. Next day lines shall extend horizontally in both directions
2. Now the current day signal lines and labels will display only during live market session which will come from Study file. After market close and when tradingview marks EOD around 7.30 - 8 PM the next day signals will come from this strategy file. This is to avoid display clutter when both current and next day labels are shown together after market close. After market close and till tradingview marks EOD no labels shall be displayed.
發行說明
1. Increased label size for better visibility in web and mobile platforms.2. Tooltip info added for labels to aid user comprehension of the tool labels.
3. Settings window organized better with tooltip info fields for each option to aid user comprehension of individual fields.
No algo changes have been made as this is a 30 year backtested algorithm powering the system. All changes are basically on the visual graphics side for a better user experience. This strategy file helps user to backtest the tool and also generates the next day signal levels after market close.
發行說明
V2.4 Change List 1. Daily signal price levels are now rounded to the nearest integer.
2. Code cleanup for slightly faster load time.
發行說明
Change List V2.51. Option price correction factor (OPC) added. OPC is a simple and crude experimental factor to estimate the call option price when spot price hits the daily long level. The factor is calculated as 0.9 x absolute value of difference between daily long level and close price. The OPC can be adjusted against LTP of the call option to place pre set orders in trading platform. Use it at your own risk and along with tradingview alerts near signal levels to readjust the pre set orders using OPC for better accuracy.
2. Bug fix - the label display turned off between pre market close and market open. This is now fixed.
發行說明
Version 2.6 release change list. Happy Trading !!!1. OPC correction factor adjusted to 0.92 to fix rare order miss triggering.
2. Label info text modifications for ease of readability.
3. Label moved slightly to the left for easy visibility on mobile layout.
4. Minor code cleanup.
發行說明
Version 2.7 release change list. Happy Trading !!!1. Upgraded codebase from PINE V4 to V5. Better performance due to more efficient code made possible by PINE V5.
2. Next day levels used to come from strategy file earlier. These levels will now come from the Study file which drastically reduces the code size of the strategy script. This will help to reduce the load time and execution time. Also less clutter on chart with one less file to load while trading with TrendShikari NTS. Only study file is needed most of the time. Use the strategy file only when you want to backtest on Nifty with TrendShikari NTS.
發行說明
V2.8 Release NotesEnabled FinNifty spot and BankNifty Spot charts for experimental testing. Both these indices are heavy with couple of banking stocks and hence can be more volatile. Typically this means more capital requirement relative to Nifty index for similar drawdown %.
發行說明
V2.9 Release Notes1. Enabled Long only, Short only or Dual mode backtest capability.
2. Disabled bar magnifier option as the strategy file was not working for non premium TV users.
發行說明
V3.0 Release Notes1. The backtesting bug that crept into the last version was fixed.
2. Cleaned up code to remove some deprecated syntax constructs in the Pine script.
僅限邀請腳本
只有經作者授權的使用者才能訪問此腳本,且通常需付費。您可以將此腳本加入收藏,但需先向作者申請並獲得許可後才能使用 — 點擊此處了解更多。如需更多詳情,請依照作者說明或直接聯繫syam-mohan-vs。
除非您完全信任其作者並了解腳本的工作原理,否則TradingView不建議您付費或使用腳本。您也可以在我們的社群腳本中找到免費的開源替代方案。
作者的說明
TrendShikari NTS is a Nifty Index, Swing Type, analysis tool which can be used to build a Mechanical Trading System for Nifty. Use the strategy file for backtesting TrendShikari NTS. Visit http://www.t7wealth.com to request access to the strategy file.
提醒:在請求訪問權限之前,請閱讀僅限邀請腳本指南。
Syam @ T7 - Makes Life Easier.
You can support me by opening an account with Dhan via link - t7trade.com
You can support me by opening an account with Dhan via link - t7trade.com
免責聲明
這些資訊和出版物並不意味著也不構成TradingView提供或認可的金融、投資、交易或其他類型的意見或建議。請在使用條款閱讀更多資訊。