OPEN-SOURCE SCRIPT
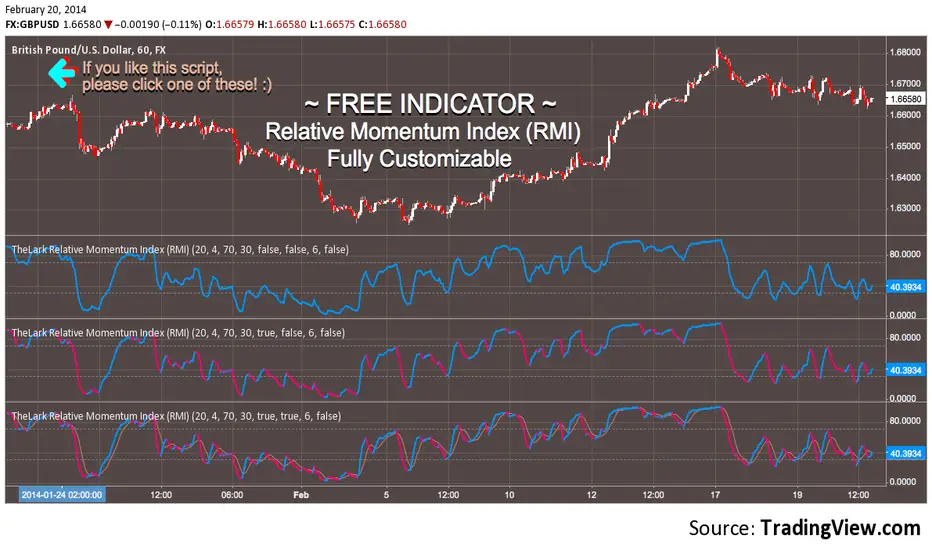
FREE INDICATOR: Relative Momentum Index (RMI)
RMI, as requested by glaz
Description:
The Relative Momentum Index was developed by Roger Altman and was introduced in his article in the February, 1993 issue of Technical Analysis of Stocks & Commodities magazine.
While your typical RSI counts up and down days from close to close, the Relative Momentum Index counts up and down days from the close relative to a close x number of days ago. The result is an RSI that is a bit smoother.
Usage:
Use in the same way you would any other RSI. There are overbought and oversold zones, and can also be used for divergence and trend analysis .
Grab the source code here: pastebin.com/LRVusQmy
Installation video by ChrisMoody here : vimeopro.com/user14689865/tradingviewcom-how-to-videos
░░░░░░░░░░░░░░░ Feel free to follow me to keep up with my latest scripts! ░░░░░░░░░░░░░░░
░░░░░░░░░░░░ PLEASE THUMB UP OR STAR IF YOU LIKE THIS INDICATOR! ░░░░░░░░░░░░
I'd like as many people as possible to get it :)
開源腳本
本著TradingView的真正精神,此腳本的創建者將其開源,以便交易者可以查看和驗證其功能。向作者致敬!雖然您可以免費使用它,但請記住,重新發佈程式碼必須遵守我們的網站規則。
免責聲明
這些資訊和出版物並不意味著也不構成TradingView提供或認可的金融、投資、交易或其他類型的意見或建議。請在使用條款閱讀更多資訊。
免責聲明
這些資訊和出版物並不意味著也不構成TradingView提供或認可的金融、投資、交易或其他類型的意見或建議。請在使用條款閱讀更多資訊。