shardison

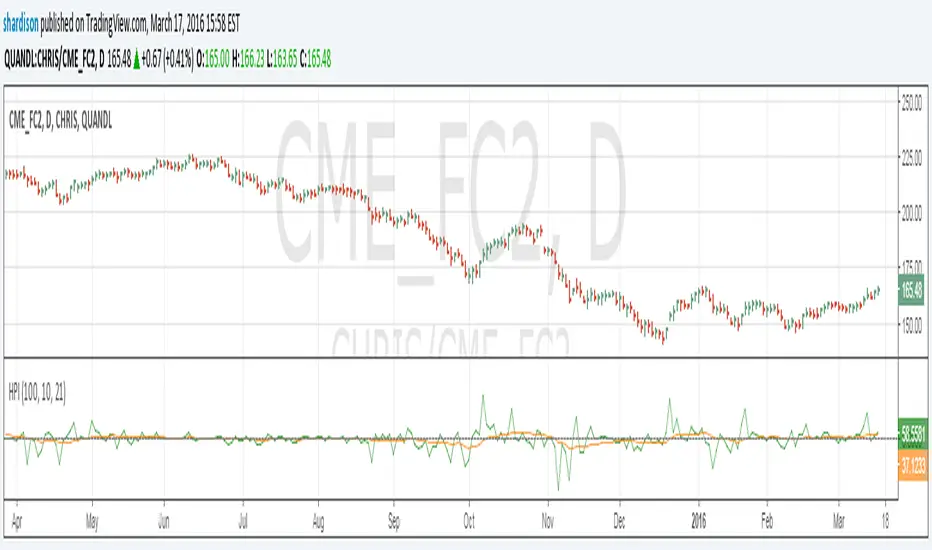
Herrick Payoff Index for Quandl Data

Update to my previous Herrick Payoff Index script. This script pulls Quandl futures data with daily open interest. The prior version only used the weekly Commitment of Traders open interest data so could only be used on weekly bars. Note: Must use Quandl Symbol methodology in chart (i.e. enter symbol as QUANDL:CHRIS/CME_FC2, QUANDL:CME/FCX2016, ect.). Unfortunately, I haven't been able to program this to pull from the embedded futures data.

Need seasonals for futures data on NQ, ES, YM, or other commodities. Check out www.agresticresearch.com.
開源腳本

本著真正的TradingView精神,該腳本的作者將其開源發布,以便交易者可以理解和驗證它。為作者喝彩吧!您可以免費使用它,但在出版物中重複使用此代碼受網站規則的約束。 您可以收藏它以在圖表上使用。

免責聲明

這些資訊和出版物並不意味著也不構成TradingView提供或認可的金融、投資、交易或其他類型的意見或建議。請在使用條款閱讀更多資訊。

想在圖表上使用此腳本?
////////////////////////////////////////////////////////////
//  Copyright by shardison v2.0 03/17/2016

//NOTE: I have only been able to figure out how to pull open interest data from Quandl datasets. So you will need to use the Quandl method to pull data into the chart (i.e. QUANDL:CHRIS/CME_CL1).

// Attention:
//The Herrick Payoff Index (HPI) was developed by John Herrick and is the only well known indicator that uses price, volume, and open interest.
// The Herrick Payoff Index is designed to show the amount of money flowing into or out of a futures contract. 
//The Index uses open interest during its calculations, therefore, the security being analyzed must contain open interest.


//Interpretation
//
//When the Herrick Payoff Index is above zero, it shows that money is flowing into the futures contract (which is bullish). 
//When the Index is below zero, it shows that money is flowing out of the futures contract (which is bearish).
//
//The interpretation of the Herrick Payoff Index involves looking for divergences between the Index and prices.
////////////////////////////////////////////////////////////

study(title="Herrick Payoff Index for Quandl Data", shorttitle="HPI")
valueofonecentmove = input(100, minval=1)
multiplyingfactor = input(10, minval=1)
wmaperiod = input(21, minval=1)

oi = security(tickerid+"|7", "D", close)

openinterestdiff = oi - oi[1]
I = abs(openinterestdiff)
G = max(oi, oi[1])
S = multiplyingfactor
C = valueofonecentmove
V = volume
M = (high + low) / 2
My = M[1]
K1 = (C*V*(M - My))*(1 + ((2 * I)/(G)))
K2 = (C*V*(M - My))*(1 - ((2 * I)/(G)))
K = M > My ? K1 : K2
Ky = K[1]
HPI = ((Ky +(K - Ky)) * S)/100000
HPI_Index = 100 * (HPI - lowest(HPI,100))/(highest(HPI,100) - lowest(HPI,100))
wma = wma(HPI, wmaperiod)
plot(HPI, color=green, title="HPI")
plot (wma, color=orange, title="HPI Weighted Moving Average")
plot(HPI_Index, color=aqua, title="HPI Index-Turn off all others")

hline(0, color=gray, title="Zero", linestyle=dashed)
plot(oi, color = gray, title="OI")