INVITE-ONLY SCRIPT
已更新 Point of Return - Dynamic Price Reaction Ranges
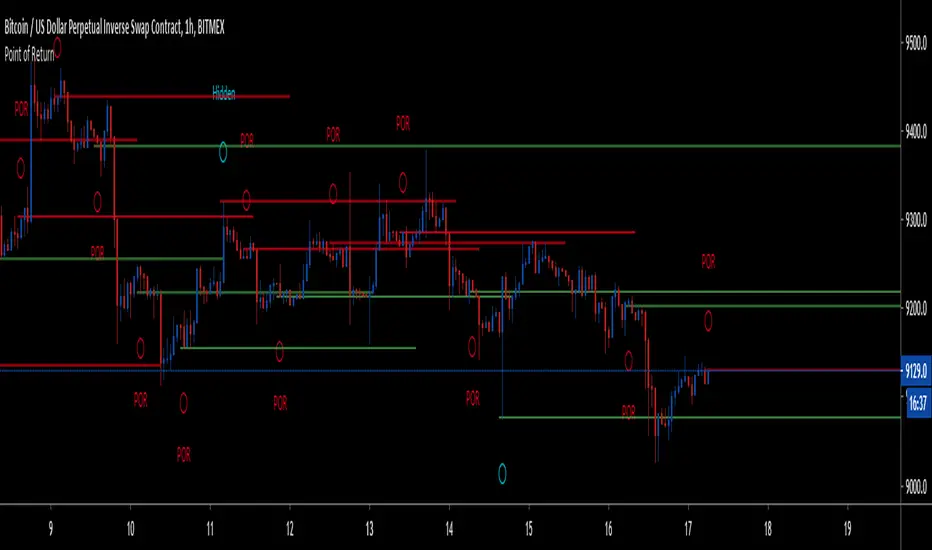
This is one of the many parts of my upcoming strategy, and used by me on daily basis.
This indicator incorporates various price action models and candlestick patterns, and combines them together to form a price point which is highly reactive in nature.
In the background it works on multitude of permutations and combinations to calculate the price point which tell us exactly where price will most likely react in the future, removing rooms for errors while drawing support and resistance .
This can be used on multiple ways:
1. Chop indication - As soon as the indication pops up, it marks a price which is most likely start of a chop zone and break from either direction marks end of the chop zone.
2. Point of Return - As soon as a the price moves away from the chop zone, it will most likely return to the indicated price before moving in the direction of the break, giving us high RR trades.
3. Dynamic Support and Resistance - This also acts as a dynamic support and resistance and apart from your already established S/R you can incorporate these price points as your decision maker or breakers.
PS : This is not to be used as a Buy/Sell signals and is only should act as confirmation of what you already know and to gauge the market sentiments.
There is a hidden easter egg on this page and chart which gives you preview of the upcoming indicator. Have fun finding out.
You can reach me here on my DM for more details.
Below are the few snaps from different timeframes:
1. 4H XBTUSD -
2. 2H XBTUSD -
3. 8H XBTUSD -
發行說明
Calculation Update發行說明
Added Line ExtensionsAdded Drop Down Menu for Length Selection
Added Condition to stop plotting line once price moves across the line
Added Minimum line extension length
僅限邀請腳本
僅作者批准的使用者才能訪問此腳本。您需要申請並獲得使用許可,通常需在付款後才能取得。更多詳情,請依照作者以下的指示操作,或直接聯絡FiatDropout。
TradingView不建議在未完全信任作者並了解其運作方式的情況下購買或使用腳本。您也可以在我們的社群腳本中找到免費的開源替代方案。
作者的說明
@fiatdropout
免責聲明
這些資訊和出版物並非旨在提供,也不構成TradingView提供或認可的任何形式的財務、投資、交易或其他類型的建議或推薦。請閱讀使用條款以了解更多資訊。
僅限邀請腳本
僅作者批准的使用者才能訪問此腳本。您需要申請並獲得使用許可,通常需在付款後才能取得。更多詳情,請依照作者以下的指示操作,或直接聯絡FiatDropout。
TradingView不建議在未完全信任作者並了解其運作方式的情況下購買或使用腳本。您也可以在我們的社群腳本中找到免費的開源替代方案。
作者的說明
@fiatdropout
免責聲明
這些資訊和出版物並非旨在提供,也不構成TradingView提供或認可的任何形式的財務、投資、交易或其他類型的建議或推薦。請閱讀使用條款以了解更多資訊。