INVITE-ONLY SCRIPT
Vaidotas Momentum Score
Hello Traders!
Discover Myfractalrange latest addition on TradingView, Vaidotas Segenis Momentum Score.
How people calculate Momentum is subjective and many people (even professionals) use different Momentum formulas depending on how they view it. This is sometimes confusing for traders.
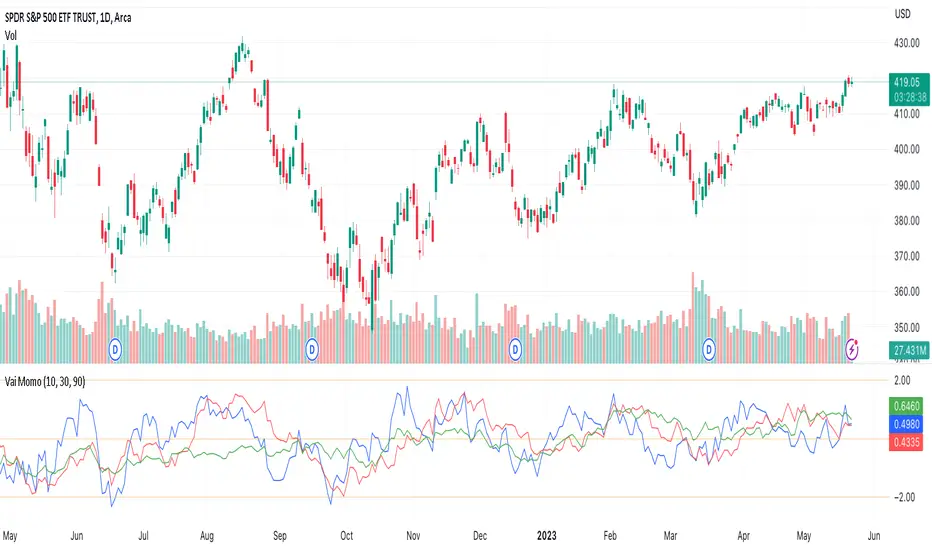
The purpose of this indicator is to identify periods of strong price momentum relative to historical volatility. Higher momentum scores indicate stronger price trends, while lower scores suggest weaker trends. Traders and investors may use this indicator to identify potential buy or sell signals based on the strength of price movements. The formula Vaidotas uses calculate Momentum Score for different periods based on the price data.
There are 3 different look back periods in the script, you will find them in "Input":
Period 1 : 10 Days
Period 2 : 30 Days
Period 3 : 90 Days
Now let's go over the different steps of the formula:
Step 1 - Calculate the daily normal returns : this gives the daily percentage change in price
Step 2 - Calculate the standard deviation of the daily normal returns over a specific look back period (Default: 100 days) : the standard deviation measures the volatility or dispersion of the returns
Step 4 - Calculate the squared standard deviation multiplied by the square root of the respective period: This is done for three different periods (Period 1, Period 2, Period 3), it amplifies the standard deviation by the square root of the period, which gives more weight to recent price changes.
Step 5 - Calculate the normal returns for each period: This calculates the percentage change in price over the specified period
Step 5 - Calculate the momentum score for each period: This score represents the relative strength or momentum of the price change compared to the expected volatility.
Using the momentum indicator involves interpreting the values and considering certain thresholds to make trading decisions. While there is no definitive rule for all markets and assets, we can provide you with a general guideline on how traders may want to use the indicator and explain the significance of certain values:
1) Strong Trend: When the momentum score is significantly positive (above a certain threshold, such as +2), it suggests a strong upward price trend.
2) Weak Trend: Conversely, when the momentum score is significantly negative (below a certain threshold, such as -2), it indicates a strong downward price trend. Traders may interpret this as a potential signal to enter or maintain a short position, expecting the trend to continue.
3) Lack of Trend: When the momentum score is close to zero, it suggests a lack of significant trend or sideways movement in the price. Values around 0 indicate a potential range-bound market or consolidation.
However, it's important to note that the specific threshold values for defining significant trends or reversals may vary depending on the asset, timeframe, and market conditions. Traders often adjust these thresholds based on their own experience and backtesting results.
Here are a few more examples to illustrate the use of the momentum indicator:
- Example 1 - Strong Uptrend Confirmation :
The momentum score is consistently above +2, indicating a strong upward trend. Traders may consider this as a potential signal to enter or maintain a long position, expecting the trend to continue.
- Example 2 - Reversal Signal :
The momentum score has been positive for an extended period but starts to decline and eventually crosses below -2. This could be seen as a potential reversal signal, suggesting that the uptrend is losing strength and a bearish trend might develop. Traders may consider exiting long positions or even taking short positions based on this reversal signal.
- Example 3 - Sideways Market :
The momentum score fluctuates around 0, without displaying any significant positive or negative values. This indicates a lack of clear trend and suggests that the asset is trading in a range or consolidating. Traders may choose to avoid taking new positions until a stronger trend emerges.
Why is it interesting to use different look back periods?
The use of different look back periods in the momentum indicator formula allows traders to assess momentum across multiple timeframes. By comparing the momentum results for each period, traders can gain a broader perspective on the strength of the trend and potential opportunities. Here's how a trader might use the different look back periods and their corresponding momentum results:
1) Identifying Consistency: Traders can compare the momentum results for different periods to assess the consistency of the trend. If the momentum scores for all periods are consistently positive or negative, it suggests a strong and consistent trend across multiple timeframes. This can provide traders with higher confidence in the trend's strength and potential trading opportunities.
2) Convergence or Divergence: Traders can analyze the relationship between the momentum results for different periods. If the momentum scores for all periods are converging (moving closer together), it indicates a higher degree of agreement across different timeframes and strengthens the signal. Conversely, if the momentum scores for different periods diverge (move apart), it may suggest a weakening or conflicting trend. Traders should exercise caution when the momentum scores diverge as it may signal a potential reversal or market uncertainty.
3) Confirmation of Momentum: Traders can use the momentum results for different periods to confirm the strength of a trend. For example, if the momentum scores for shorter periods (e.g., Period 1) are significantly higher than those for longer periods (e.g., Period 2 and Period 3), it suggests a recent increase in momentum and a potentially stronger trend. This confirmation can assist traders in making more informed trading decisions and timing their entries or exits.
4) Multiple Timeframe Analysis: Traders often employ a multiple timeframe analysis approach to validate their trading decisions. By comparing the momentum results for different periods, traders can assess the alignment of momentum across various timeframes. For instance, if the momentum scores for shorter, medium, and longer periods all indicate a strong trend in the same direction, it reinforces the conviction in the trade.
As a conclusion, the momentum indicator can be useful to traders for several reasons:
1) Identifying Trend Strength: The momentum indicator helps traders assess the strength of a price trend. When the momentum score is high, it suggests that the trend is strong and likely to continue. This information can be valuable for trend-following strategies, as it helps traders identify potentially profitable opportunities and stay on the right side of the market.
2) Spotting Reversals: Momentum indicators can also help traders identify potential trend reversals. When the momentum score diverges from the price movement, it may indicate a weakening trend or an upcoming reversal. Traders can use this signal to adjust their positions or look for opportunities to enter or exit trades.
3) Confirming Breakouts: Breakout traders often use momentum indicators to confirm the validity of a breakout. If a price breaks above a resistance level, and the momentum score also increases significantly, it provides additional confirmation that the breakout is strong and may continue. This helps traders have more confidence in their breakout trades.
4) Setting Stop Loss and Take Profit Levels: By understanding the strength of a price trend through the momentum indicator, traders can set appropriate stop-loss and take-profit levels. A strong momentum score may indicate that a trend is likely to continue, allowing traders to set wider profit targets. Conversely, a weak momentum score may suggest that the trend is losing steam, prompting traders to set tighter stop-loss levels to protect their capital.
4) Divergence Analysis: Momentum indicators can be used in conjunction with other technical indicators to identify divergences. Divergence occurs when the price and momentum indicator move in opposite directions. It can signal potential trend reversals or shifts in market sentiment, providing traders with opportunities to adjust their positions.
It's important to note that while momentum indicators can be useful tools, they should not be relied upon solely for making trading decisions. It's recommended to use them in conjunction with other technical analysis tools and consider other factors such as market conditions, risk management, and fundamental analysis. Remember that the momentum indicator is just one tool among many, and it's important to consider other factors such as volume, trend, volatility, and overall market conditions when making trading decisions. Additionally, using stop-loss orders and proper risk management techniques is crucial to mitigate potential losses.
We hope that you will find these explanations useful, please contact us by private message for access.
Enjoy!
DISCLAIMER: No sharing, copying, reselling, modifying, or any other forms of use are authorised. This script is strictly for individual use and educational purposes only. This is not financial or investment advice. Investments are always made at your own risk and are based on your personal judgement. Myfractalrange is not responsible for any losses you may incur. Please invest wisely.
Discover Myfractalrange latest addition on TradingView, Vaidotas Segenis Momentum Score.
How people calculate Momentum is subjective and many people (even professionals) use different Momentum formulas depending on how they view it. This is sometimes confusing for traders.
The purpose of this indicator is to identify periods of strong price momentum relative to historical volatility. Higher momentum scores indicate stronger price trends, while lower scores suggest weaker trends. Traders and investors may use this indicator to identify potential buy or sell signals based on the strength of price movements. The formula Vaidotas uses calculate Momentum Score for different periods based on the price data.
There are 3 different look back periods in the script, you will find them in "Input":
Period 1 : 10 Days
Period 2 : 30 Days
Period 3 : 90 Days
Now let's go over the different steps of the formula:
Step 1 - Calculate the daily normal returns : this gives the daily percentage change in price
Step 2 - Calculate the standard deviation of the daily normal returns over a specific look back period (Default: 100 days) : the standard deviation measures the volatility or dispersion of the returns
Step 4 - Calculate the squared standard deviation multiplied by the square root of the respective period: This is done for three different periods (Period 1, Period 2, Period 3), it amplifies the standard deviation by the square root of the period, which gives more weight to recent price changes.
Step 5 - Calculate the normal returns for each period: This calculates the percentage change in price over the specified period
Step 5 - Calculate the momentum score for each period: This score represents the relative strength or momentum of the price change compared to the expected volatility.
Using the momentum indicator involves interpreting the values and considering certain thresholds to make trading decisions. While there is no definitive rule for all markets and assets, we can provide you with a general guideline on how traders may want to use the indicator and explain the significance of certain values:
1) Strong Trend: When the momentum score is significantly positive (above a certain threshold, such as +2), it suggests a strong upward price trend.
2) Weak Trend: Conversely, when the momentum score is significantly negative (below a certain threshold, such as -2), it indicates a strong downward price trend. Traders may interpret this as a potential signal to enter or maintain a short position, expecting the trend to continue.
3) Lack of Trend: When the momentum score is close to zero, it suggests a lack of significant trend or sideways movement in the price. Values around 0 indicate a potential range-bound market or consolidation.
However, it's important to note that the specific threshold values for defining significant trends or reversals may vary depending on the asset, timeframe, and market conditions. Traders often adjust these thresholds based on their own experience and backtesting results.
Here are a few more examples to illustrate the use of the momentum indicator:
- Example 1 - Strong Uptrend Confirmation :
The momentum score is consistently above +2, indicating a strong upward trend. Traders may consider this as a potential signal to enter or maintain a long position, expecting the trend to continue.
- Example 2 - Reversal Signal :
The momentum score has been positive for an extended period but starts to decline and eventually crosses below -2. This could be seen as a potential reversal signal, suggesting that the uptrend is losing strength and a bearish trend might develop. Traders may consider exiting long positions or even taking short positions based on this reversal signal.
- Example 3 - Sideways Market :
The momentum score fluctuates around 0, without displaying any significant positive or negative values. This indicates a lack of clear trend and suggests that the asset is trading in a range or consolidating. Traders may choose to avoid taking new positions until a stronger trend emerges.
Why is it interesting to use different look back periods?
The use of different look back periods in the momentum indicator formula allows traders to assess momentum across multiple timeframes. By comparing the momentum results for each period, traders can gain a broader perspective on the strength of the trend and potential opportunities. Here's how a trader might use the different look back periods and their corresponding momentum results:
1) Identifying Consistency: Traders can compare the momentum results for different periods to assess the consistency of the trend. If the momentum scores for all periods are consistently positive or negative, it suggests a strong and consistent trend across multiple timeframes. This can provide traders with higher confidence in the trend's strength and potential trading opportunities.
2) Convergence or Divergence: Traders can analyze the relationship between the momentum results for different periods. If the momentum scores for all periods are converging (moving closer together), it indicates a higher degree of agreement across different timeframes and strengthens the signal. Conversely, if the momentum scores for different periods diverge (move apart), it may suggest a weakening or conflicting trend. Traders should exercise caution when the momentum scores diverge as it may signal a potential reversal or market uncertainty.
3) Confirmation of Momentum: Traders can use the momentum results for different periods to confirm the strength of a trend. For example, if the momentum scores for shorter periods (e.g., Period 1) are significantly higher than those for longer periods (e.g., Period 2 and Period 3), it suggests a recent increase in momentum and a potentially stronger trend. This confirmation can assist traders in making more informed trading decisions and timing their entries or exits.
4) Multiple Timeframe Analysis: Traders often employ a multiple timeframe analysis approach to validate their trading decisions. By comparing the momentum results for different periods, traders can assess the alignment of momentum across various timeframes. For instance, if the momentum scores for shorter, medium, and longer periods all indicate a strong trend in the same direction, it reinforces the conviction in the trade.
As a conclusion, the momentum indicator can be useful to traders for several reasons:
1) Identifying Trend Strength: The momentum indicator helps traders assess the strength of a price trend. When the momentum score is high, it suggests that the trend is strong and likely to continue. This information can be valuable for trend-following strategies, as it helps traders identify potentially profitable opportunities and stay on the right side of the market.
2) Spotting Reversals: Momentum indicators can also help traders identify potential trend reversals. When the momentum score diverges from the price movement, it may indicate a weakening trend or an upcoming reversal. Traders can use this signal to adjust their positions or look for opportunities to enter or exit trades.
3) Confirming Breakouts: Breakout traders often use momentum indicators to confirm the validity of a breakout. If a price breaks above a resistance level, and the momentum score also increases significantly, it provides additional confirmation that the breakout is strong and may continue. This helps traders have more confidence in their breakout trades.
4) Setting Stop Loss and Take Profit Levels: By understanding the strength of a price trend through the momentum indicator, traders can set appropriate stop-loss and take-profit levels. A strong momentum score may indicate that a trend is likely to continue, allowing traders to set wider profit targets. Conversely, a weak momentum score may suggest that the trend is losing steam, prompting traders to set tighter stop-loss levels to protect their capital.
4) Divergence Analysis: Momentum indicators can be used in conjunction with other technical indicators to identify divergences. Divergence occurs when the price and momentum indicator move in opposite directions. It can signal potential trend reversals or shifts in market sentiment, providing traders with opportunities to adjust their positions.
It's important to note that while momentum indicators can be useful tools, they should not be relied upon solely for making trading decisions. It's recommended to use them in conjunction with other technical analysis tools and consider other factors such as market conditions, risk management, and fundamental analysis. Remember that the momentum indicator is just one tool among many, and it's important to consider other factors such as volume, trend, volatility, and overall market conditions when making trading decisions. Additionally, using stop-loss orders and proper risk management techniques is crucial to mitigate potential losses.
We hope that you will find these explanations useful, please contact us by private message for access.
Enjoy!
DISCLAIMER: No sharing, copying, reselling, modifying, or any other forms of use are authorised. This script is strictly for individual use and educational purposes only. This is not financial or investment advice. Investments are always made at your own risk and are based on your personal judgement. Myfractalrange is not responsible for any losses you may incur. Please invest wisely.
僅限邀請腳本
僅作者批准的使用者才能訪問此腳本。您需要申請並獲得使用許可,通常需在付款後才能取得。更多詳情,請依照作者以下的指示操作,或直接聯絡myfractalrange。
TradingView不建議在未完全信任作者並了解其運作方式的情況下購買或使用腳本。您也可以在我們的社群腳本中找到免費的開源替代方案。
作者的說明
To request access to this script, contact us direction by private message
Manage your portfolio using a Trend based system | Trial plans available on myfractalrange.com| ETFs, stocks, bonds, cryptos
免責聲明
這些資訊和出版物並非旨在提供,也不構成TradingView提供或認可的任何形式的財務、投資、交易或其他類型的建議或推薦。請閱讀使用條款以了解更多資訊。