INVITE-ONLY SCRIPT
ProfitAlgo.io TrendSync Simulation
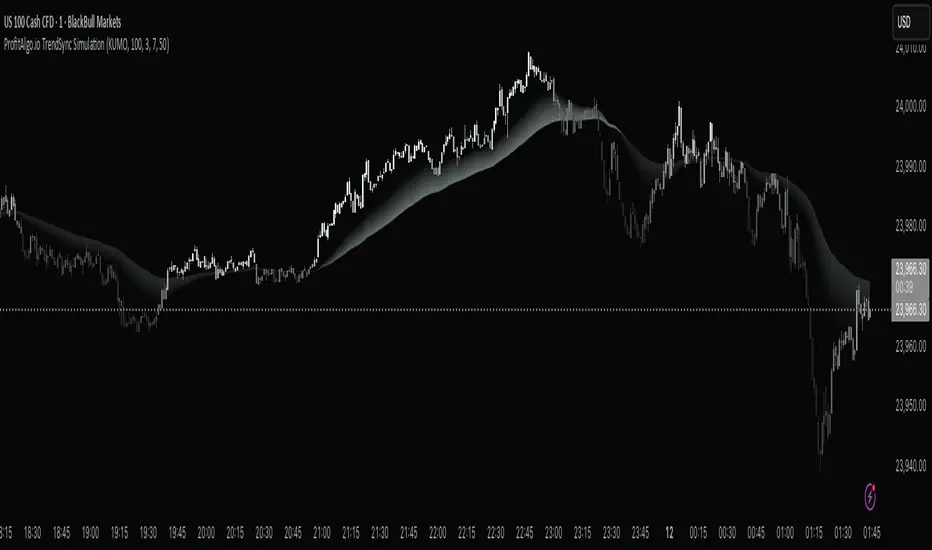
The TrendSync Simulation is a gradient-based trend-following framework that helps traders quickly identify bullish vs bearish market structure while filtering out short-term noise.
Instead of relying on a single moving average or indicator, TrendSync builds a layered “trend cloud” in 3 different MODES, KUMO, PFA, HMA anchored against a reference band. These layers create a visual gradient that shifts with market direction.
When combined with its color-adaptive candles, you can turn off your candle setting colors within the chart settings of TradingView for the TrendSync color mapping which transforms raw price action into an easy-to-read flow map of institutional momentum.
📊 How It Works
Each layer creates a smooth gradient that shifts with trend direction:
Candles are also dynamically colored based on normalized momentum, allowing traders to see directional strength at a glance.
🔑 Key Features
✅ Gradient Cloud – A layered trend structure that visually shifts from bearish → bullish.
✅ Multiple Modes – Choose between KUMO, PFA, or HMA logic for responsiveness vs. smoothness.
✅ Dynamic Trend Candles – Bars adapt color based on momentum strength.
✅ Customizable Visualization – Adjust transparency, colors, and gradient strength to fit your chart style.
✅ Clarity of Direction – Highlights dominant flow while reducing noise from minor fluctuations.
⚙️ Settings Explained
💡 Use Cases
⚡ Why It Matters
Markets often look chaotic on raw candlestick charts. TrendSync cuts through that noise by layering moving averages into a visual gradient, revealing institutional momentum in real time. Whether scalping, day trading, or swing trading, TrendSync provides a synchronized view of trend direction that adapts to different trading styles.
⚡ Paired with the Back End Order Matrix, TrendSync provides the clarity of direction after liquidity zones are exposed, creating a complete institutional-style framework inside TradingView.
EXAMPLE 1A

EXAMPLE 1B

EXAMPLE 1C

EXAMPLE 2A

Instead of relying on a single moving average or indicator, TrendSync builds a layered “trend cloud” in 3 different MODES, KUMO, PFA, HMA anchored against a reference band. These layers create a visual gradient that shifts with market direction.
When combined with its color-adaptive candles, you can turn off your candle setting colors within the chart settings of TradingView for the TrendSync color mapping which transforms raw price action into an easy-to-read flow map of institutional momentum.
📊 How It Works
Each layer creates a smooth gradient that shifts with trend direction:
- Bullish trends form a rising, green-shaded cloud.
- Bearish trends form a descending, red-shaded cloud.
- Transitions appear as fading or compressing gradients, signaling potential reversals or consolidations.
Candles are also dynamically colored based on normalized momentum, allowing traders to see directional strength at a glance.
🔑 Key Features
✅ Gradient Cloud – A layered trend structure that visually shifts from bearish → bullish.
✅ Multiple Modes – Choose between KUMO, PFA, or HMA logic for responsiveness vs. smoothness.
✅ Dynamic Trend Candles – Bars adapt color based on momentum strength.
✅ Customizable Visualization – Adjust transparency, colors, and gradient strength to fit your chart style.
✅ Clarity of Direction – Highlights dominant flow while reducing noise from minor fluctuations.
⚙️ Settings Explained
- Trend Method (KUMO / PFA / HMA): Controls the type of moving average used for the cloud.
- Gradient Colors: Define the shading of bullish vs. bearish zones.
- Transparency Controls: Adjust how strong or subtle the gradient cloud appears.
- Lookback Length: Longer = smoother trend; shorter = more reactive.
💡 Use Cases
- Identify trend bias quickly without switching between multiple indicators.
- Confirm entries with liquidity or breakout strategies by aligning with the cloud.
- Detect weakening or strengthening momentum via gradient compression.
- Avoid trading against dominant higher time-frame flow with trend-colored candles.
⚡ Why It Matters
Markets often look chaotic on raw candlestick charts. TrendSync cuts through that noise by layering moving averages into a visual gradient, revealing institutional momentum in real time. Whether scalping, day trading, or swing trading, TrendSync provides a synchronized view of trend direction that adapts to different trading styles.
⚡ Paired with the Back End Order Matrix, TrendSync provides the clarity of direction after liquidity zones are exposed, creating a complete institutional-style framework inside TradingView.
EXAMPLE 1A
EXAMPLE 1B
EXAMPLE 1C
EXAMPLE 2A
僅限邀請腳本
僅作者批准的使用者才能訪問此腳本。您需要申請並獲得使用許可,通常需在付款後才能取得。更多詳情,請依照作者以下的指示操作,或直接聯絡PropFirmAlgo。
TradingView不建議在未完全信任作者並了解其運作方式的情況下購買或使用腳本。您也可以在我們的社群腳本中找到免費的開源替代方案。
作者的說明
Visit PropFirmAlgo.com for Lifetime Premium Access
Get access to our exclusive tools: propfirmalgo.com
Join Free Community: discord.gg/gFJAGF7gYc
All content provided by PropFirm Algo is for informational & educational purposes only. Past performance does not guarantee future results
Join Free Community: discord.gg/gFJAGF7gYc
All content provided by PropFirm Algo is for informational & educational purposes only. Past performance does not guarantee future results
免責聲明
這些資訊和出版物並非旨在提供,也不構成TradingView提供或認可的任何形式的財務、投資、交易或其他類型的建議或推薦。請閱讀使用條款以了解更多資訊。