PROTECTED SOURCE SCRIPT
SigmoidCycle Oscillator [LuminoAlgo]
Purpose:
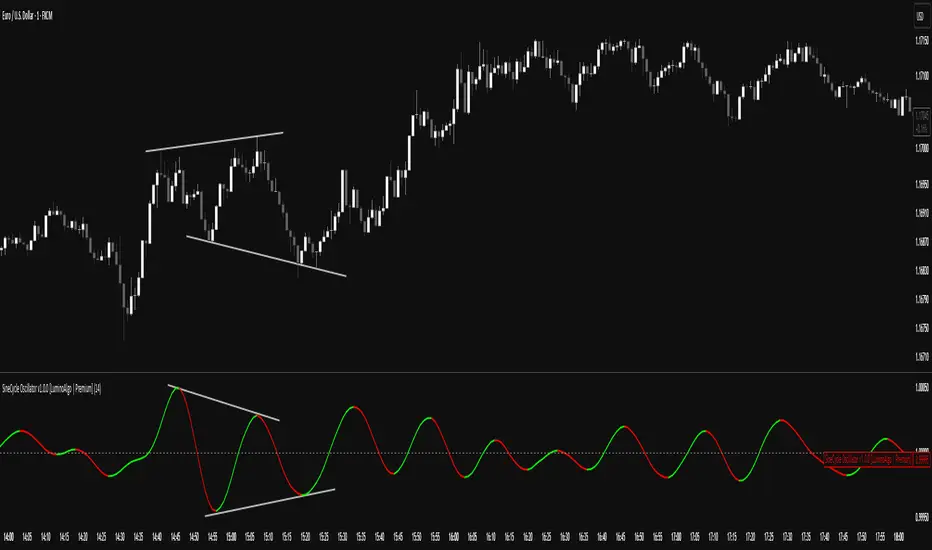
The SineCycle Oscillator measures price momentum using sigmoid function mathematics (S-curve transformation) borrowed from neural network theory. It generates an oscillator that fluctuates around 1.0, identifying momentum shifts and potential reversal points.
Mathematical Foundation:
This indicator applies the sigmoid logistic function concept: y = 1/(1+e^-x), which creates an S-shaped curve. In financial markets context, this transformation:
- Maps price changes to a bounded range (-1 to +1)
- Provides non-linear sensitivity (high near zero, low at extremes)
- Naturally filters outliers without lag penalty
Calculation Process:
1. Statistical Normalization: Price deviations are measured from a moving average baseline and scaled by recent volatility (standard deviation over N periods)
2. Sigmoid Transformation: Normalized values undergo S-curve transformation, which weights small movements linearly but compresses large movements logarithmically
3. Dual Timeframe Analysis:
• Short window: User-defined period (N)
• Long window: Double period (2N)
• Ratio calculation: Short sigmoid average ÷ Long sigmoid average
4. Volatility-Weighted Smoothing: Final values use exponential smoothing where the smoothing factor adjusts based on the coefficient of variation (volatility/mean ratio)
What Makes This Different:
Unlike linear momentum oscillators (RSI, Stochastic) that use fixed mathematical relationships, the sigmoid transformation creates variable sensitivity zones. This mimics how professional traders mentally weight price movements.
Trading Application:
Signal Types:
- Momentum: Green (>1.0) = bullish, Red (<1.0) = bearish
- Reversals: 1.0 line crosses with volume confirmation
- Divergence: Price makes new high/low, oscillator doesn't
- Exhaustion: Extended readings (>1.2 or <0.8) suggest overextension
Optimal Conditions:
- Works best: Trending markets with clear swings
- Avoid: Low volume, ranging markets under 1% daily movement
- Timeframes: 4H and above for reliability
Parameter Guidelines:
- Length 8-10: Day trading (expect more whipsaws)
- Length 14-20: Swing trading (balanced signals)
- Length 25-30: Position trading (fewer, stronger signals)
Limitations:
- Lag increases with higher length settings
- Can give false signals during news-driven spikes
- Requires additional confirmation in choppy markets
Trading Framework:
Based on momentum persistence theory - assumes trends continue until sigmoid curve flattens (indicating momentum exhaustion). The mathematical model captures both mean reversion (extreme readings) and trend following (mid-range readings) characteristics.
受保護腳本
此腳本以閉源形式發佈。 不過,您可以自由使用,沒有任何限制 — 點擊此處了解更多。
Creating indicators for empowered trading! - LuminoAlgo
All content provided by Luminoalgo is for informational and educational purposes only. Past performance is not indicative of future results.
All content provided by Luminoalgo is for informational and educational purposes only. Past performance is not indicative of future results.
免責聲明
這些資訊和出版物並非旨在提供,也不構成TradingView提供或認可的任何形式的財務、投資、交易或其他類型的建議或推薦。請閱讀使用條款以了解更多資訊。