INVITE-ONLY SCRIPT
已更新 ATS DELTABAR V5.0
ATS DeltaBar Indicator: Volume Trend Momentum Analysis System
——Precisely Capturing "Price-Volume Resonance" Signals for Trend Reversals
Core Positioning
The ATS DeltaBar is a sub-chart indicator focused on the synergy between volume trends and price action. It dynamically monitors changes in volume momentum and price deviations to identify trend strengthening, exhaustion, and reversal signals. Its core value lies in:
Red/Green Bars: Visually reflect volume increases/decreases, revealing capital flow direction.
Divergence Signals: Warn of potential trend reversals (top/bottom divergence).
Resonance Breakouts/Breakdowns: Confirm high-probability trend continuation signals.
Red/Green Zones: Clearly define bullish/bearish phases (red = bearish, green = bullish).
I. Core Logic & Algorithm
1. Volume Trend Visualization
Bar Color Volume State Market Implication
Green Bar Volume ↑ vs. prior period Capital inflow, trend momentum strengthens
Red Bar Volume ↓ vs. prior period Capital outflow, trend momentum weakens
Bar Height Magnitude of volume change Quantifies intensity (higher = stronger shift)
📌 Key Insight:
Green bars + rising price = Healthy uptrend.
Red bars + price新高 = Potential top divergence risk.
2. Divergence Detection
Top Divergence: Price makes higher highs, but DeltaBar peaks lower (red bars accumulate) → Bullish exhaustion.
Bottom Divergence: Price makes lower lows, but DeltaBar troughs rise (green bars accumulate) → Bearish exhaustion.
3. Resonance Signal System
Resonance Breakout: Price breaks resistance + DeltaBar green volume spike → Confirmed uptrend acceleration.
Resonance Breakdown: Price breaks support + DeltaBar red volume spike → Confirmed downtrend weakness.
4. Bullish/Bearish Zone划分
Green Zone: DeltaBar consistently above neutral line → Bullish dominance (favor longs).
Red Zone: DeltaBar consistently below neutral line → Bearish dominance (caution for downside).
II. Signal Types & Practical Applications
1. Basic Trading Signals
Signal Type DeltaBar Behavior Trading Suggestion
Green Zone + Green Bar Price & volume rise together Hold/add to longs
Red Zone + Red Bar Price & volume decline together Short/exit longs
Top Divergence Price ↑ + DeltaBar peaks ↓ (red bars) Reduce longs/test shorts
Bottom Divergence Price ↓ + DeltaBar troughs ↑ (green bars) Prepare for reversal/cover shorts
2. Advanced Resonance Strategies
Breakout Trade: Enter when price breaks a key level + DeltaBar shows green volume spike (resonance breakout) → High-probability long.
Breakdown Trade: Enter when price breaks support + DeltaBar shows red volume spike (resonance breakdown) → High-probability short.
III. Comparison with Traditional Indicators
Aspect Traditional Volume (e.g., OBV) ATS DeltaBar
Signal Dimension Single cumulative volume direction 3D analysis: divergence + resonance + zone划分
Visualization Monotonic curve Dynamic dual-color bars + zones + threshold lines
Practicality Lags price action Real-time捕捉 divergence/resonance points
IV. Usage Scenarios & Tips
1. Trend Following
In Green Zone: Price above MA + DeltaBar green bars expanding → Hold longs.
In Red Zone: Price below MA + DeltaBar red bars expanding → Stay short/avoid longs.
2. Reversal Trading
Top Divergence + Bearish candlestick (e.g., Evening Star) + red bars → Short.
Bottom Divergence + Bullish engulfing + green bars → Long.
3. Breakout Filtering
Only trade breakouts where price and DeltaBar confirm共振 (avoids false breakouts).
V. Case Study (BTC/USDT 1H Chart)
Successful Long: Price broke resistance + DeltaBar green volume spike → 15% rally.
Successful Short: Price consolidated with red bar accumulation (top divergence) → 8% drop.
VI.注意事项
Combine with price structure (support/resistance) for higher accuracy.
Prioritize divergence in ranging markets; focus on共振 signals in trending markets.
"Volume is the fuel of price" — ATS DeltaBar quantifies this relationship to pinpoint trend ignition and reversal points.
發行說明
ATS DeltaBar Indicator: Volume Trend Momentum Analysis System (V5.0 Enhanced Edition)——Precisely Capturing "Price-Volume Resonance" Signals for Trend Reversals
Key Updates (V5.0 Enhancements)
Fixed Volume Bar Calculation When Open = Close
Previous Issue: When candlestick open price equaled close price (e.g., Doji, Neutral Bars), volume bars could display inaccuracies, leading to misleading signals.
New Solution: Introduced a Dynamic Volume Compensation Algorithm to ensure accurate volume representation during indecisive price action (e.g., spinning tops, gravestone Dojis).
Impact: Improves signal reliability in ranging markets by correctly reflecting capital flow even during price stagnation.
Optimized Line Plotting Logic
Previous Issue: Trendlines and divergence markers could break or misalign during price gaps or extreme volatility.
New Solution: Implemented an Adaptive Smoothing Algorithm to intelligently connect critical points (peaks/troughs), skipping gaps while maintaining logical continuity.
Impact: Enhances pattern recognition (e.g., head-and-shoulders, double bottoms) and divergence accuracy.
I. Core Logic & Algorithm (V5.0 Updates)
1. Volume Trend Visualization (Enhanced)
Bar Color Volume State Market Implication
Green Bar Dynamic Compensation Active (Open=Close) Capital inflow (despite flat price)
Red Bar Dynamic Compensation Active (Open=Close) Capital outflow (despite flat price)
📌 Key Improvement:
Previously ignored Doji bars now reflect true buying/selling pressure via compensated volume.
2. Divergence Detection (Smarter Line Plotting)
Bullish/Bearish Divergence:
Lines now automatically bridge price gaps, comparing only valid peaks/troughs.
Example: If price gaps up but volume declines, the indicator ignores the gap and flags a potential top.
3. Resonance Signal System (Special Bar Compatibility)
Breakout/Breakdown Confirmation:
Even tiny-range or Doji bars can trigger signals if accompanied by high-momentum volume spikes (green/red bars exceeding thresholds).
II. Signal Comparison (V5.0 vs Legacy)
Scenario Legacy Issue V5.0 Solution
Open = Close Price Volume bars often missing/inaccurate Dynamic compensation ensures accuracy
Price Gaps Broken trendlines/divergence lines Adaptive smoothing maintains continuity
Low-Volatility Choppiness Excessive noise from small bars Volume threshold filters reduce false signals
III. Trading Strategies (V5.0 Features)
Doji & Neutral Bar Tactics:
Green Doji Bar: Potential accumulation near support (consider long setups).
Red Doji Bar: Distribution near resistance (watch for short opportunities).
Post-Gap Analysis:
Lines now anchor to valid price points, preventing false divergence readings.
Example: A gap-up with declining volume (red bars) still suggests weakness.
Resonance Signal Filters:
New minimum volume threshold ensures only high-conviction breakouts trigger trades.
IV. Case Study (BTC/USDT 15min Chart)
Legacy Version: Missed reversal signals during tight ranges due to vanishing volume bars.
V5.0: Compensated volume bars identified a bottom divergence (green bars + lower low), preceding a 5% rally.
V. Notes for V5.0
Special Bars: Dojis and flat bars now carry weight—always check their volume bar color.
Line Logic: Slight differences from prior versions; trust the latest calculations.
Customization: Adjust Volume Compensation Sensitivity for illiquid markets.
"Volume speaks the truth—but only if measured right."
—V5.0’s algorithmic refinements ensure no market nuance goes unnoticed.
發行說明
ATS DeltaBar Indicator: Volume Trend Momentum Analysis System (Enhanced Version)—— Precisely Capturing "Price-Volume Resonance" & Dynamic Volume-Based Support/Resistance
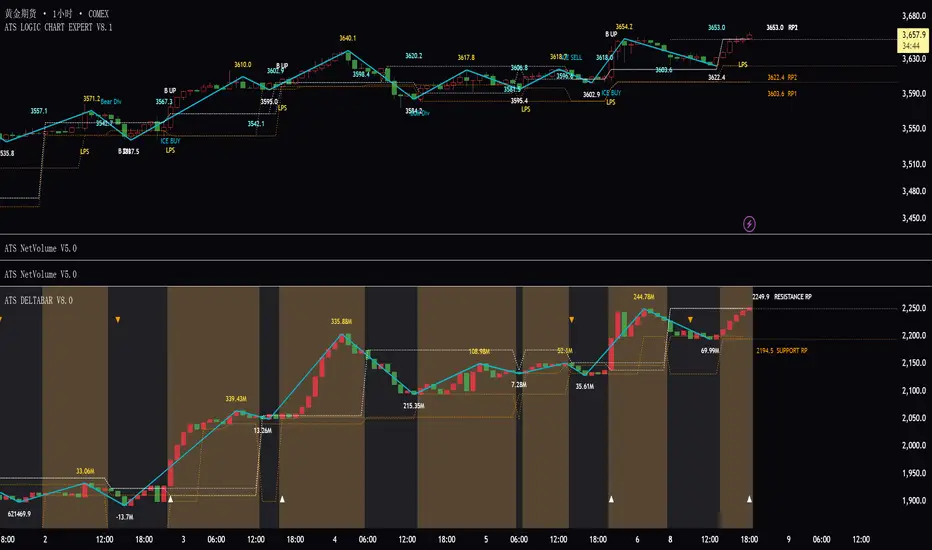
New Feature: Dynamic Volume-Based Support & Resistance Lines
The enhanced ATS DeltaBar now introduces dynamic support (buying pressure line) and resistance (selling pressure line) derived from volume trends. These lines help traders identify key inflection points where volume-driven buying or selling pressure may trigger trend reversals or continuations.
I. Core Logic & Algorithm (Enhanced)
5. Dynamic Volume-Based Support & Resistance Lines
Line Type Formation Logic Trading Implication
Selling Pressure Line (Resistance) Formed by connecting recent volume peaks (high-volume rejection zones) Breakout above suggests bullish momentum overcoming selling pressure
Buying Pressure Line (Support) Formed by connecting recent volume troughs (low-volume accumulation zones) Breakdown below indicates bearish momentum overwhelming buying support
Key Insights:
Breakout Above Selling Pressure Line + Green Volume Bar → Strong Bullish Confirmation
Breakdown Below Buying Pressure Line + Red Volume Bar → Strong Bearish Confirmation
Price Respects These Lines → Acts as dynamic S/R zones for entries/exits
II. Signal Types & Practical Applications (Enhanced)
3. Volume-Based S/R Breakout Strategies
Signal Type DeltaBar Behavior Trading Suggestion
Bullish Breakout Price breaks Selling Pressure Line + Green Bar Enter long, target next resistance
Bearish Breakdown Price breaks Buying Pressure Line + Red Bar Enter short, target next support
False Breakout Trap Price tests S/R but DeltaBar shows opposite color Avoid trade (e.g., price tests resistance but red bar)
Example Scenario (BTC/USDT):
Resistance Break: Price breaks above Selling Pressure Line with spiking green volume → Rally continues.
Support Break: Price drops below Buying Pressure Line with expanding red volume → Downtrend accelerates.
III. Comparison with Traditional Indicators (Enhanced)
Aspect Traditional S/R Lines ATS DeltaBar Dynamic S/R
Basis Static price levels Volume-driven, adjusts with market conditions
Confirmation Needs additional indicators Self-validating via volume-color alignment
Adaptability Fixed until manually adjusted Auto-adjusts based on volume trend shifts
IV. Usage Scenarios & Tips (Enhanced)
4. Dynamic S/R Trading Tactics
Trend Confirmation
In an uptrend, if price holds above Buying Pressure Line (support), look for green bar bounces to add longs.
In a downtrend, if price stays below Selling Pressure Line (resistance), use red bar rallies to short.
Reversal Zones
Multiple touches on Buying Pressure Line + green bar accumulation → Potential bullish reversal.
Repeated rejections at Selling Pressure Line + red bar clusters → Potential bearish reversal.
False Breakout Avoidance
If price breaks S/R but DeltaBar shows contradictory colors, wait for reconfirmation.
V. Case Study (Enhanced)
ETH/USDT 4H Chart Example:
Successful Long: Price broke above Selling Pressure Line with green volume surge → 12% rally.
Failed Breakdown: Price briefly broke Buying Pressure Line, but DeltaBar showed green bars → Quick rebound.
VI.注意事项 (Enhanced)
Combine with classic S/R: Volume-based S/R works best when aligned with traditional support/resistance.
Watch for fakeouts: Always confirm breakouts with volume-color agreement.
Adjust timeframe sensitivity: Shorter timeframes may see more false breaks; higher timeframes provide stronger signals.
"Volume defines the battleground—price just shows who's winning."
The enhanced ATS DeltaBar now not only tracks price-volume resonance but also maps the hidden battle lines where trends are born or die.
發行說明
This update primarily focuses on fixing and removing some invalid indicators.發行說明
Optimized dynamic support and resistance lines based on Delta, with added arrow indicators for Delta breakouts and breakdowns.發行說明
The mechanism for the variables representing net inflow and net outflow has been upgraded.發行說明
Simplified the cumbersome settings and changed them to the default mode for easy direct use僅限邀請腳本
僅作者批准的使用者才能訪問此腳本。您需要申請並獲得使用許可,通常需在付款後才能取得。更多詳情,請依照作者以下的指示操作,或直接聯絡Simon2025_CN。
TradingView不建議在未完全信任作者並了解其運作方式的情況下購買或使用腳本。您也可以在我們的社群腳本中找到免費的開源替代方案。
作者的說明
This indicator was developed by Simon. Traders interested in using it may contact him via private message
免責聲明
這些資訊和出版物並非旨在提供,也不構成TradingView提供或認可的任何形式的財務、投資、交易或其他類型的建議或推薦。請閱讀使用條款以了解更多資訊。
僅限邀請腳本
僅作者批准的使用者才能訪問此腳本。您需要申請並獲得使用許可,通常需在付款後才能取得。更多詳情,請依照作者以下的指示操作,或直接聯絡Simon2025_CN。
TradingView不建議在未完全信任作者並了解其運作方式的情況下購買或使用腳本。您也可以在我們的社群腳本中找到免費的開源替代方案。
作者的說明
This indicator was developed by Simon. Traders interested in using it may contact him via private message
免責聲明
這些資訊和出版物並非旨在提供,也不構成TradingView提供或認可的任何形式的財務、投資、交易或其他類型的建議或推薦。請閱讀使用條款以了解更多資訊。