OPEN-SOURCE SCRIPT
Fisher Transform of On Balance Volume (by ChartArt)
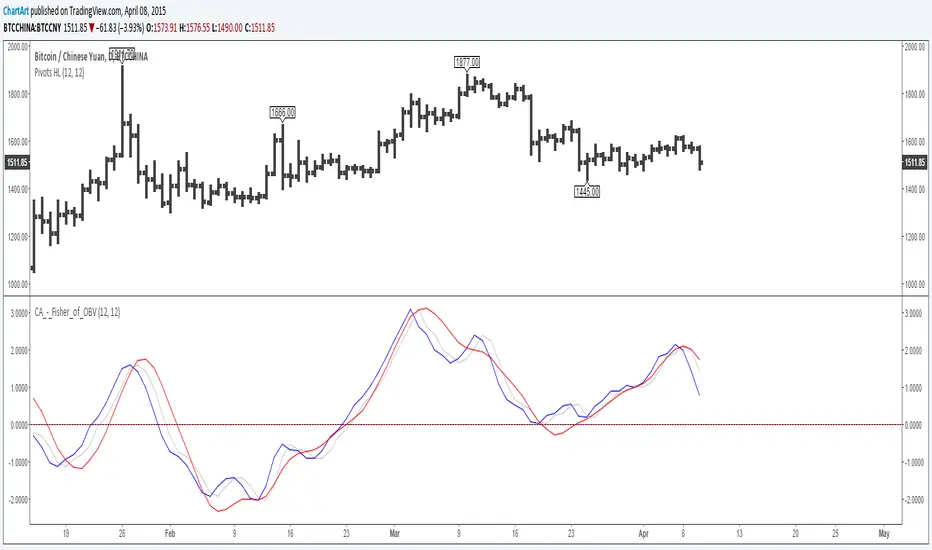
A simple mash-up of the On Balance Volume (OBV) indicator with the Fisher Transform indicator (blue) with the classic Fisher Transform signal trigger (silver color), plus a linear regression as a second signal line (red).
I recommend to use a period for the linear regression which has the same speed or is slower than the period of the Fisher Transform to avoid overshooting.
P.S. Here are three areas where the indicator worked quite good on historic charts


I recommend to use a period for the linear regression which has the same speed or is slower than the period of the Fisher Transform to avoid overshooting.
P.S. Here are three areas where the indicator worked quite good on historic charts
開源腳本
本著TradingView的真正精神,此腳本的創建者將其開源,以便交易者可以查看和驗證其功能。向作者致敬!雖然您可以免費使用它,但請記住,重新發佈程式碼必須遵守我們的網站規則。
免責聲明
這些資訊和出版物並不意味著也不構成TradingView提供或認可的金融、投資、交易或其他類型的意見或建議。請在使用條款閱讀更多資訊。
開源腳本
本著TradingView的真正精神,此腳本的創建者將其開源,以便交易者可以查看和驗證其功能。向作者致敬!雖然您可以免費使用它,但請記住,重新發佈程式碼必須遵守我們的網站規則。
免責聲明
這些資訊和出版物並不意味著也不構成TradingView提供或認可的金融、投資、交易或其他類型的意見或建議。請在使用條款閱讀更多資訊。