OPEN-SOURCE SCRIPT
Semi Deviation Point Percent
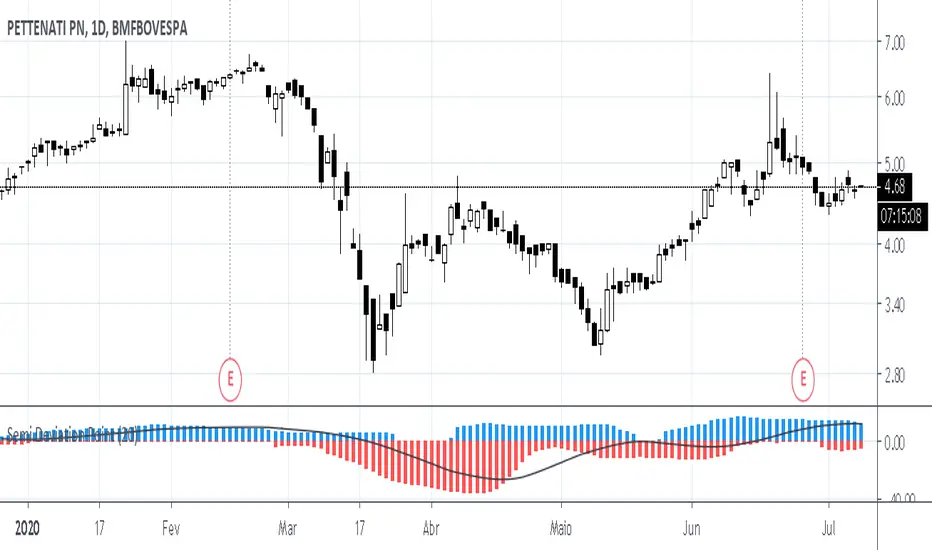
The Semi Deviation Point calculates the positive value as the standard deviation of only samples that has high value than the simple moving average. The negative value is the same standard deviation, but only uses the low value and multiply for -1.
After this calculate the value is divide by the value of simple moving average and multiplied by hundred to get a percent value from 0% to 100%.
The delta line is a simple moving average from the differences of the two values.
How it should be read?
If positive values are greater than negative values than the volatility is happen on higher prices and not lower.
If positive values are lower than negative values than the volatility is happen on lower prices and not higher.
If you know that in which market you would opt in? Is it less risk the prior?
開源腳本
秉持TradingView一貫精神,這個腳本的創作者將其設為開源,以便交易者檢視並驗證其功能。向作者致敬!您可以免費使用此腳本,但請注意,重新發佈代碼需遵守我們的社群規範。
免責聲明
這些資訊和出版物並非旨在提供,也不構成TradingView提供或認可的任何形式的財務、投資、交易或其他類型的建議或推薦。請閱讀使用條款以了解更多資訊。
免責聲明
這些資訊和出版物並非旨在提供,也不構成TradingView提供或認可的任何形式的財務、投資、交易或其他類型的建議或推薦。請閱讀使用條款以了解更多資訊。