OPEN-SOURCE SCRIPT
Weighted Momentum and Volatility Indicator (WMI)
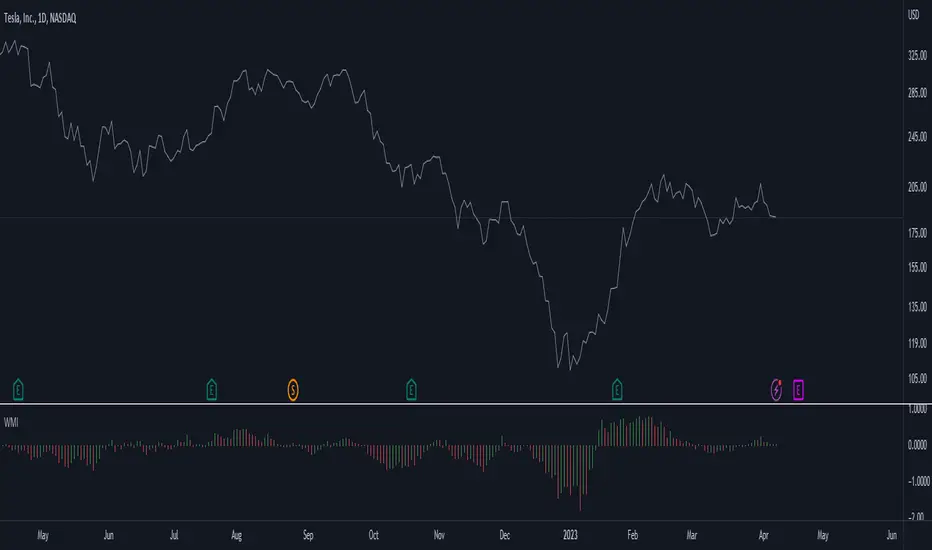
The Weighted Momentum and Volatility Indicator (WMI) is a composite technical analysis tool that combines momentum and volatility to identify potential trend changes in the underlying asset.
The WMI is displayed as an histogram that oscillates around a zero line, with increasing bars indicating a bullish trend and decreasing bars indicating a bearish trend.
The WMI is calculated by combining the Rate of Change (ROC) and Average True Range (ATR) indicators.
The ROC measures the percentage change in price over a set period of time, while the ATR measures the volatility of the asset over the same period.
The WMI is calculated by multiplying the normalized values of the ROC and ATR indicators, with the normalization process being used to adjust the values to a scale between 0 and 1.
Traders and investors can use the WMI to identify potential trend changes in the underlying asset, with increasing bars indicating a bullish trend and decreasing bars indicating a bearish trend.
The WMI can be used in conjunction with other technical analysis tools to develop a comprehensive trading strategy.
Do not hesitate to let me know your comments if you see any improvements to be made :)
開源腳本
本著TradingView的真正精神,此腳本的創建者將其開源,以便交易者可以查看和驗證其功能。向作者致敬!雖然您可以免費使用它,但請記住,重新發佈程式碼必須遵守我們的網站規則。
The trend is your friend, until it's not...
免責聲明
這些資訊和出版物並不意味著也不構成TradingView提供或認可的金融、投資、交易或其他類型的意見或建議。請在使用條款閱讀更多資訊。
開源腳本
本著TradingView的真正精神,此腳本的創建者將其開源,以便交易者可以查看和驗證其功能。向作者致敬!雖然您可以免費使用它,但請記住,重新發佈程式碼必須遵守我們的網站規則。
The trend is your friend, until it's not...
免責聲明
這些資訊和出版物並不意味著也不構成TradingView提供或認可的金融、投資、交易或其他類型的意見或建議。請在使用條款閱讀更多資訊。