PROTECTED SOURCE SCRIPT
已更新 Whale Activity Classic[nakano]
## Whale Activity Classic [nakano]
### Uncover the Hidden Intent of Volume
The **Whale Activity Classic [nakano]** indicator provides an unparalleled view into the nuanced volume dynamics within each candlestick. By analyzing sub-timeframe volume, it visually separates significant **large investor** activity from typical "Noise" volume, helping you understand the true forces driving price action.
This tool is designed to reveal the otherwise invisible movements of **large investors** and gauge overall market participation, giving you a deeper understanding than standard volume bars alone.
---
### Key Features:
* **Multi-Layered Volume Bars:**
* **Large Investor Volume (Densely Colored Bars):** Represents the aggregated volume from sub-timeframe candles where individual volume exceeded your defined threshold. Green indicates buying pressure (positive), and red indicates selling pressure (negative).
* **Normal Volume (Lightly Colored Bars):** Shows the total volume from sub-timeframe trades that fell *below* the threshold. This provides context about general market participation.
* **Comprehensive Customization:**
* **Symbol Selection:** Analyze the current chart's symbol or specify any custom symbol (e.g., crypto, stocks, forex) for in-depth analysis.
* **Lower Timeframe Analysis:** Choose your desired granularity from 1-second, 5-second, 10-second, 30-second, 1-minute, 5-minute, or 15-minute sub-timeframes.
* **Volume Thresholding:** Opt for a `Manual` fixed threshold or an `Automatic` calculation that adapts to current market conditions.
* **Noise Volume Visibility:** Toggle the display of "Normal Volume" bars to focus on **large investor** activity or view the complete picture.
* **Extensive Color Settings:** Customize the colors and transparency for all four volume types (**large investor** Positive/Negative, Normal Positive/Negative) to match your visual preferences.
---
### How to Use & Interpretation Tips:
* **Understanding Auto-Calculated Thresholds:** When `Automatic` calculation is selected, hover your cursor over any bar. The exact "Current Threshold" applied to that bar will be displayed in the status line at the top-left of the indicator panel.
* **Spotting Large Investor Intent:**
* If **Large Investor Volume (green/red bars)** is prominent while **Normal Volume (lightly colored bars)** is small, it suggests a sudden, significant move by a **large investor**, potentially against the prevailing retail sentiment.
* Conversely, if both **Large Investor Volume** and Normal Volume are large, it indicates strong trend momentum, drawing in both large institutions and retail participants.
* **Measuring Trend Strength:** Combined large **Large Investor Volume** and Normal Volume bars signify a robust trend with broad market participation.
* **Default Settings:** The automatic threshold's default settings (Period: 100, Multiplier: 25) are balanced for broad market application. However, we recommend adjusting these values to optimize performance for your specific asset and trading style.
---
### Important Notes:
* Analyzing longer chart timeframes (e.g., 1-hour, daily) with very low sub-timeframes may process a large amount of data, potentially affecting performance or causing errors. Using this indicator on **minute timeframes** is recommended.
* Always ensure your `Analysis Timeframe (Lower)` is **shorter** than your main chart's timeframe.
* Access to second-based timeframes (1S, 5S, etc.) requires a paid TradingView plan.
---
---
### 出来高の隠れた意図を解き明かす
**Whale Activity Classic [nakano]** インジケーターは、各ローソク足内で展開される微細な出来高の力関係を、かつてないほど詳細に可視化します。より短い時間足の出来高を分析することで、重要な**大口投資家**の活動と、一般的な「通常出来高(ノイズ)」を視覚的に分離し、値動きを動かす真の力を理解する手助けをします。
このツールは、通常の出来高バーでは見えない**大口投資家**の動きと、市場全体の参加状況を同時に把握するために設計されており、標準的な出来高表示だけでは得られない深い洞察を提供します。
---
### 主な機能:
* **多層的な出来高バー:**
* **大口投資家出来高(濃い色のバー):** 指定した閾値を超えた、より短い時間足の個々の出来高を合計したものです。緑色は買い圧力(プラス方向)、赤色は売り圧力(マイナス方向)を示します。
* **通常出来高(薄い色のバー):** 閾値に満たなかった取引の合計出来高を示します。これにより、一般的な市場参加の状況を把握できます。
* **包括的なカスタマイズ性:**
* **銘柄選択:** 現在のチャートの銘柄を分析することも、暗号資産、株式、FXなど、任意のカスタム銘柄を指定して詳細な分析を行うこともできます。
* **分析する時間足 (下位):** 1秒、5秒、10秒、30秒、1分、5分、15分から、分析の粒度を選択できます。
* **出来高の閾値:** 固定値を設定する「手動」モードと、現在の市場状況に適応する「自動」計算モードを選択できます。
* **通常出来高の表示:** チェックボックスで「通常出来高」バーの表示/非表示を切り替え、**大口投資家**の活動に焦点を当てるか、全体像を見るかを選択できます。
* **詳細なカラー設定:** 4種類の出来高タイプ(**大口投資家**プラス/マイナス、通常プラス/マイナス)すべての色と透明度を自由にカスタマイズできます。
---
### 使い方と分析のヒント:
* **自動計算された閾値の確認方法:** 「自動」計算を選択した場合、任意のバーにカーソルを合わせると、インジケーターパネルの左上にあるステータスラインに、そのバーに適用された正確な「現在の計算閾値」が表示されます。
* **大口投資家の意図を読み解く:**
* **大口投資家出来高(緑/赤のバー)が際立っている一方で、通常出来高(薄い色のバー)が小さい場合**、それは一般的な小売りのセンチメントとは異なる、**大口投資家**による突然の重要な動きを示唆している可能性があります。
* 逆に、**大口投資家出来高**と通常出来高の両方が大きい場合、それは大規模な機関投資家と個人投資家の両方を巻き込んだ、強いトレンドが発生していることを示します。
* **トレンドの勢いを測る:** **大口投資家出来高**と通常出来高のバーの両方が大きい場合、それは活発な市場参加を伴う、堅調なトレンドを示します。
* **デフォルト設定について:** 自動閾値のデフォルト設定(期間:100、倍率:25)は、幅広い市場に適用できるようバランスが取れています。ただし、ご自身の分析対象となる資産や取引スタイルに合わせて、これらの値を調整することをお勧めします。
---
### 重要な注意事項:
* メインチャートの時間足を長く(例:1時間足、日足)しすぎると、非常に細かい下位の時間足で大量のデータを処理することになり、パフォーマンスが低下したり、エラーが発生する可能性があります。このインジケーターは**分足での使用を推奨**します。
* 「分析する時間足 (下位)」は、必ずメインチャートの時間足より**短いもの**を選択してください。
* 秒足(1S、5Sなど)での分析には、TradingViewの有料プランへの加入が必要です。
---
發行說明
#### **Title**Whale Activity[nakano]
#### **Summary**
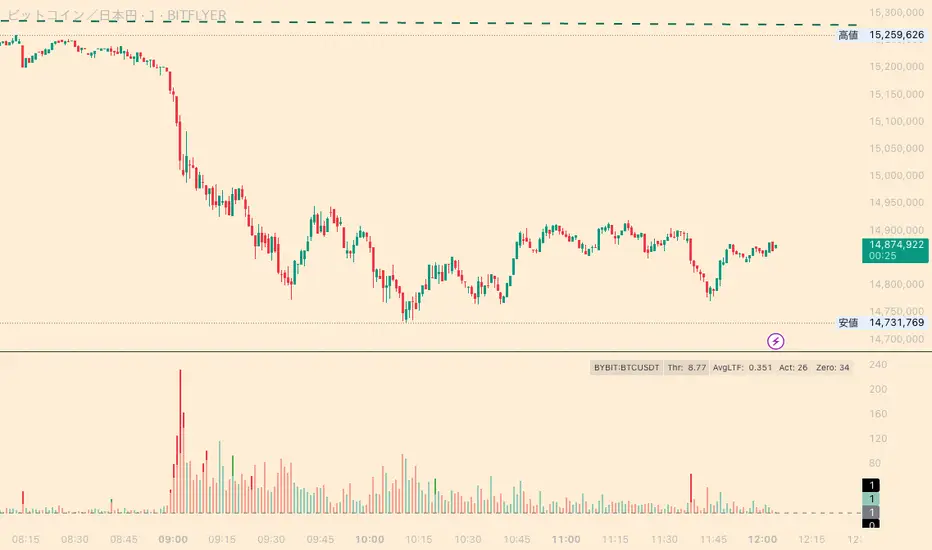
This indicator visualizes the micro-level power dynamics occurring inside each candlestick. It analyzes the volume of a user-defined lower timeframe (e.g., 1-second) within each bar of the main chart (e.g., 5-minute) and separately plots both the "whale" volume that exceeds a significant threshold and the "noise" volume from smaller, everyday trades.
It's a tool designed to help you trace the footprints of "whales" (large-scale investors) while also understanding the general market activity, something often hidden in standard volume bars.
#### **Key Features**
* **Multi-Layered Volume Bars:**
* **Whale Volume (Dark Green/Red Bars):** Represents the sum of volume from bullish (up) or bearish (down) lower-timeframe candles that **exceeded** the volume threshold. This signifies significant buying or selling pressure.
* **Normal Volume (Faint Pastel Bars):** Represents the sum of volume from candles that were **below** the threshold. This shows the general "background noise" or base level of activity.
* **Complete Customization (via Settings Panel):**
* **Symbol Method:** Choose to analyze the symbol on your current chart automatically, or specify a custom symbol (e.g., from Crypto, Stocks, Forex).
* **Analysis Timeframe (Lower):** Choose the granularity of your analysis (1S, 5S, 1M, etc.) from a dropdown menu.
* **Threshold Method:** Set the volume threshold manually or use the "Automatic" method.
* **Smart Automatic Threshold:** The automatic calculation is now more robust. It intelligently ignores zero-volume intervals to calculate a more realistic average, giving you a reliable threshold even in low-activity markets. You can control its `Period` and `Multiplier`.
* **Display Toggles:** You can show/hide the "Normal Volume" base and the "Debug Info" table.
* **Advanced Color Settings:** All colors are fully customizable. You can also switch the coloring logic for the "Normal Volume" bars.
#### **How to Use & Interpretation Tips**
* **How to Check the Auto Threshold:**
When using the "Automatic" threshold method, you can see the exact threshold value being applied to any given bar. Simply hover your cursor over a bar in the indicator panel, and the value will appear in the status line at the top-left of the panel, labeled **'Current Threshold'**.
* **Identify True Intent:**
A large green/red "whale" bar appearing on top of low gray "noise" can indicate a sudden, impactful move by a large player, distinct from the general market flow. High pastel bars with a high whale bar on top can indicate a trending move with broad participation.
* **See Through "Deceptive Volume":**
If a 5-minute candle has high total volume, but this indicator shows only large pastel bars with very small whale bars, it suggests the volume was comprised of many insignificant trades with no clear, single-minded intent from large players.
* **Threshold Adjustment is Key:**
* **Automatic Mode (Recommended):** In the default 'Automatic' mode, the indicator adapts the threshold to current market activity. Your main tuning knob is the **'Auto Multiplier'**. Increasing this value from `25` to `50`, for example, will make the indicator less sensitive, filtering for only very large moves.
* **Manual Mode:** Switch to 'Manual' mode if you want to use a fixed benchmark. The appropriate value is highly dependent on the asset. For example, while `1.0` might be a reasonable benchmark for `BITFLYER:BTCJPY` (representing 1 BTC), a stock like `NASDAQ:AAPL` could require a value of `100000` (shares). **Use the 'True Avg LTF Vol' value in the debug table as a reference to set a meaningful manual threshold.**
#### **Disclaimer**
* Using this indicator on high chart timeframes (e.g., 1H, 1D) requires fetching a very large amount of data from the lower timeframe, which may lead to performance issues or script errors. It is recommended for use on intraday timeframes.
* Always ensure the selected "Analysis Timeframe (Lower)" is shorter than or equal to your main chart's timeframe.
* Please note that using second-based timeframes (e.g., 1S, 5S) for analysis requires a paid TradingView subscription.
---
#### **概要 (Summary)**
このインジケーターは、ローソク足の内部で起きている微細な力関係を可視化します。指定した時間足(例:5分足)の中に含まれる、さらに短い時間足(例:1秒足)の出来高を分析し、閾値を超えた**「大口の出来高」**と、それに満たない**「通常の出来高」**を、積み上げ式のヒストグラムで表示します。
通常の出来高バーでは見えない「大口(クジラ)」の動きと、市場の全体的な活気を同時に把握するためのツールです。
#### **主な機能 (Key Features)**
* **多層的な出来高バー:**
* **大口の出来高(濃い色のバー):** 出来高の閾値を**超えた**陽線(買い)または陰線(売り)の出来高の合計値を表します。
* **通常の出来高(薄い色のバー):** 出来高の閾値に**満たなかった**取引の合計値を表します。
* **完全なカスタマイズ性(設定画面より):**
* **銘柄の選択方法:** 今見ているチャートの銘柄を自動で分析するか、カスタムで好きな銘柄(暗号資産、株式、FXなど)を指定するか選択できます。
* **分析する時間足 (下位):** 1秒、5秒、1分など、分析の粒度をドロップダウンから選択できます。
* **出来高の閾値設定:** 閾値は手動で固定するか、相場状況に適応する「自動」計算かを選択できます。
* **賢い自動計算:** 自動計算は、取引がなかった時間を自動的に無視し、実際に取引があった時間のみで平均出来高を計算するため、閑散とした相場でも、より現実的な閾値を提供します。計算に使う「期間」や「倍率」も調整可能です。
* **表示のON/OFF:** 「通常出来高」や「デバッグ情報テーブル」の表示/非表示を切り替えられます。
* **高度なカラー設定:** 全てのバーの色を自由に設定でき、「通常出来高」のカラーロジックも変更できます。
#### **使い方・分析のヒント (How to Use & Interpretation Tips)**
* **自動計算モードの閾値を確認する方法:**
閾値の計算方法で「自動」を選択した場合、インジケーターのバーにカーソルを合わせると、パネル左上のステータスラインに「**現在の計算閾値 / Current Threshold**」として、そのバーで適用されている正確な閾値が表示されます。
* **大口の真意を見抜く:**
淡い色のバー(通常の出来高)が小さいのに、濃い色のバー(大口の出来高)だけが突出している場合、それは市場全体の流れとは異なる、特定の大きなプレーヤーによる突然の動きである可能性を示唆します。
* **トレンドの勢いを測る:**
淡い色のバーと、その上に乗る濃い色のバーが両方とも大きい場合、それは一般参加者を巻き込んだ、勢いのあるトレンドが発生していることを示唆します。
* **閾値の調整が、このツールの鍵です:**
* **自動モード(推奨):** デフォルトの「自動」モードでは、インジケーターが相場の活気に合わせて閾値を自動調整します。ユーザーは主に**「自動計算の倍率」**を調整します。例えば、この値を`25`から`50`に上げると、より大きな動きだけを「大口」として検出するようになり、感度を鈍くできます。
* **手動モード:** 特定の数値を基準にしたい場合は、「手動」モードに切り替えます。この値は分析対象によって大きく異なります。例えば、`BITFLYER:BTCJPY`なら`1.0`(=1 BTC)が一つの基準になるかもしれませんが、株式(`AAPL`など)では`100000`(10万株)といった桁違いの数値が必要になります。**デバッグテーブルの「True Avg LTF Vol」などを参考に、適切な値を設定してください。**
#### **注意点 (Disclaimer)**
* チャートの時間足を長くする(例: 1時間足、日足)と、計算するデータ量が膨大になり、パフォーマンスが低下したり、エラーが発生する可能性があります。分足での使用を推奨します。
* 「分析する時間足 (下位)」は、必ずチャート本体の時間足よりも短いものを選択してください。
* 秒足(1S, 5Sなど)での分析には、TradingViewの有料プランへの加入が必要です。
發行說明
#### **Title**Whale Activity Classic[nakano]
#### **Summary / 概要**
This indicator visualizes the micro-level power dynamics occurring inside each candlestick. It analyzes the volume of a user-defined lower timeframe (e.g., 1-second) within each bar of the main chart (e.g., 5-minute) and separately plots both the "whale" volume that exceeds a significant threshold and the "noise" volume from smaller, everyday trades. It's a tool designed to help you trace the footprints of "whales" (large-scale investors) while also understanding the general market activity, something often hidden in standard volume bars.
このインジケーターは、ローソク足の内部で起きている微細な力関係を可視化します。指定した時間足(例:5分足)の中に含まれる、さらに短い時間足(例:1秒足)の出来高を分析し、閾値を超えた**「大口の出来高」**と、それに満たない**「通常の出来高」**を、積み上げ式のヒストグラムで表示します。通常の出来高バーでは見えない「大口(クジラ)」の動きと、市場の全体的な活気を同時に把握するためのツールです。
---
#### **Key Features / 主な機能**
* **Multi-Layered Volume Bars:**
* **Whale Volume (Dark Green/Red Bars):** Represents the sum of volume from bullish (up) or bearish (down) lower-timeframe candles that **exceeded** the volume threshold.
* **Normal Volume (Faint Pastel Bars):** Represents the sum of volume from candles that were **below** the threshold. This shows the general "background noise."
* **Complete Customization (via Settings Panel):**
* **Symbol Method:** Choose to analyze the symbol on your current chart automatically, or specify a custom symbol.
* **Analysis Timeframe (Lower):** Choose the granularity of your analysis (1S, 5S, 1M, etc.).
* **Threshold Method:** Set the volume threshold manually or use the "Automatic" method with a configurable `Period` and `Multiplier`.
* **Smart Automatic Threshold:** The automatic calculation is now more robust. It intelligently ignores zero-volume intervals to calculate a more realistic average, giving you a reliable threshold even in low-activity markets.
* **Display Toggles:** You can show/hide the "Normal Volume" base and the "Debug Info" table.
* **Advanced Color Settings:** All colors are fully customizable. You can also switch the coloring logic for the "Normal Volume" bars.
* **Custom Alerts:** Enable alerts to get notified whenever the total "Whale Volume" in a single bar exceeds a custom threshold.
***
* **多層的な出来高バー:**
* **大口の出来高(濃い色のバー):** 出来高の閾値を**超えた**取引の合計出来高。
* **通常の出来高(薄い色のバー):** 出来高の閾値に**満たなかった**取引の合計出来高。
* **完全なカスタマイズ性(設定画面より):**
* **銘柄の選択方法:** 今見ているチャートの銘柄か、カスタムで指定した銘柄かを選択可能。
* **分析する時間足 (下位):** 1秒、5秒、1分など、分析の粒度を選択可能。
* **出来高の閾値設定:** 「手動」での固定値設定と、相場状況に適応する「自動」計算を選択可能。
* **賢い自動計算:** 取引がなかった時間を自動的に無視し、より現実的な閾値を計算します。「期間」や「倍率」も調整可能です。
* **表示のON/OFF:** 「通常出来高」や「デバッグ情報テーブル」の表示/非表示を切り替えられます。
* **高度なカラー設定:** 全てのバーの色を自由に設定でき、「通常出来高」のカラーロジックも変更できます。
* **カスタムアラート:**「大口出来高」の合計が、設定した閾値を超えた場合にアラートで通知を受け取ることができます。
---
#### **How to Use & Interpretation Tips / 使い方・分析のヒント**
* **How to Set Up Alerts:**
1. Go to the indicator's settings, check **"Enable Whale Volume Alerts"**, and set your desired **'Alert Threshold'**.
2. Click the 'Add Alert' button on TradingView's top toolbar (the ⏰ icon).
3. In the 'Condition' dropdown, select this indicator: **"Whale Activity Classic..."**.
4. In the dropdown below that, select **"Any alert() function call"**.
5. Choose your preferred notification method and click 'Create'.
* **How to Check the Auto Threshold:**
When using the "Automatic" threshold method, you can see the exact threshold value being applied by hovering over a bar and looking at the **'Current Threshold'** value in the status line or the debug table.
* **Identify Divergences:** The true power of this indicator lies in identifying divergences. For example: the main chart candle is bearish (red), but the "Whale Volume" bar is green. This could indicate that whales are quietly accumulating during a price drop.
* **Threshold Adjustment is Key:**
* **Automatic Mode (Recommended):** Your main tuning knob is the **'Auto Multiplier'**. Increasing this value makes the indicator less sensitive.
* **Manual Mode:** The appropriate value is highly dependent on the asset. **Use the 'True Avg LTF Vol' value in the debug table as a reference to set a meaningful manual threshold.**
***
* **アラートの設定方法(重要)**
1. インジケーターの設定画面で、「**Enable Whale Volume Alerts**」にチェックを入れ、「**Alert Threshold**」に希望の数値を設定します。
2. TradingView上部のツールバーにある「**アラート作成**」ボタン(目覚まし時計アイコン⏰)をクリックします。
3. 「**条件**」のドロップダウンで、このインジケーター「**Whale Activity Classic...**」を選びます。
4. その下のドロップダウンでは、「**Any alert() function call**」を選択してください。
5. お好みの通知方法を選び、「作成」をクリックすれば完了です。
* **自動計算モードの閾値を確認する方法:**
「自動」モードの時、インジケーターのバーにカーソルを合わせると、ステータスラインやデバッグテーブルに「**Current Threshold**」として、そのバーで適用されている正確な閾値が表示されます。
* **ダイバージェンス(逆行現象)の発見:**
例えば、ローソク足は陰線なのに、大口出来高バーは緑色 → 大口が下落中に買い集めている可能性を示唆します。
* **閾値の調整が、このツールの鍵です:**
* **自動モード(推奨):** 主に**「自動計算の倍率」**を調整して感度を決めます。
* **手動モード:** **デバッグテーブルの「True Avg LTF Vol」などを参考に**、分析対象に合った適切な値を設定してください。
---
#### **Disclaimer / 注意点**
* Using this indicator on high chart timeframes (e.g., 1H, 1D) may lead to performance issues or script errors. It is recommended for use on intraday timeframes.
* Always ensure the selected "Analysis Timeframe (Lower)" is shorter than or equal to your main chart's timeframe.
* Please note that using second-based timeframes (e.g., 1S, 5S) for analysis requires a paid TradingView subscription.
***
* チャートの時間足を長くする(例: 1時間足、日足)と、計算するデータ量が膨大になり、パフォーマンスが低下したり、エラーが発生する可能性があります。分足での使用を推奨します。
* 「分析する時間足 (下位)」は、必ずチャート本体の時間足よりも短いものを選択してください。
* 秒足(1S, 5Sなど)での分析には、TradingViewの有料プランへの加入が必要です。
受保護腳本
此腳本以閉源形式發佈。 不過,您可以自由使用,沒有任何限制 — 點擊此處了解更多。
免責聲明
這些資訊和出版物並非旨在提供,也不構成TradingView提供或認可的任何形式的財務、投資、交易或其他類型的建議或推薦。請閱讀使用條款以了解更多資訊。
免責聲明
這些資訊和出版物並非旨在提供,也不構成TradingView提供或認可的任何形式的財務、投資、交易或其他類型的建議或推薦。請閱讀使用條款以了解更多資訊。