Rashad

MA Posture

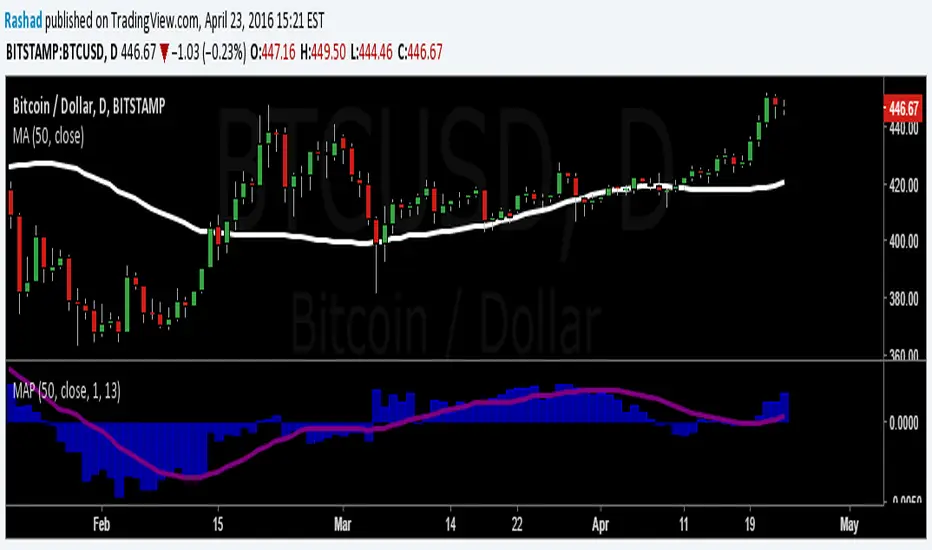
A simple script I wrote that allows you to look at the posture of a moving average. Rates of change can be useful to understanding momentum. Additionally, I have included a signal line so you can see if the posture is more or less than average.

開源腳本

本著真正的TradingView精神,該腳本的作者將其開源發布,以便交易者可以理解和驗證它。為作者喝彩吧!您可以免費使用它,但在出版物中重複使用此代碼受網站規則的約束。 您可以收藏它以在圖表上使用。

免責聲明

這些資訊和出版物並不意味著也不構成TradingView提供或認可的金融、投資、交易或其他類型的意見或建議。請在使用條款閱讀更多資訊。

想在圖表上使用此腳本?
study(title="MA Posture", shorttitle="MAP", overlay= false)
//Get input parameters------------------------------------
len = input(50, minval=1, title="Length")
src = input(close, title="Source")
posture = input(1, minval=1, title = "Look-Back Period")
signal = input(13, minval = 1, title = "Signal length")
//Calculate Posture-------------------------------------
difference = (sma(src,len) - sma(src, len)[iff(posture < len, posture, len)]) / sma(src, len)[iff(posture < len, posture, len)]
//Get a signal
sig = sma(difference, signal)
plot(difference, style = columns, color=blue, transp = 40, title="MAP")
plot(sig, style = line, color = purple, linewidth = 3, transp = 0, title = "signal line")