PROTECTED SOURCE SCRIPT
Crypto Neo - Blockchain Momentum (ETH Settings)
The Crypto Neo - Blockchain Momentum indicator analyzes Ethereum’s on-chain activity to gauge bullish or bearish trends. It combines multiple on-chain metrics and applies different moving average strategies to assess Ethereum’s momentum.
This indicator is designed to track key blockchain data sources, such as:
Hash Rate
Active Addresses
Transactions per Second
Transfers per Second
Trader Behavior
Long-Term Holders (Cruisers)
Money Flow In/Out
Total Value Locked
It processes these inputs using various Moving Average (MA) types, including SMA, EMA, DMA, to generate a Bullish Momentum Score, which is visually displayed on the chart.
How to Use:
Select MA Type – Choose between SMA, EMA, MIXMA, or DMA to determine how moving averages are applied.
Set MA Lengths – Adjust MA1 Length and MA2 Length to define short-term vs. long-term trend comparison.
Customize Data Sources – Select different on-chain metrics for the indicator to analyze.
Interpret the Bullish Momentum Score:
🟢 Green (Strong Bullish Momentum) – Bullish on-chain signals dominate.
🟡 Yellow (Moderate Bullish Momentum) – Weak bullish trend forming.
⚪ White (Neutral) – No clear trend.
🟠 Orange (Moderate Bearish Momentum) – Weak bearish signals emerging.
🔴 Red (Strong Bearish Momentum) – Bearish on-chain signals dominate.
Important Notes
* This indicator does not generate trading signals but helps interpret blockchain trends for informed decision-making.
* Since it relies on daily on-chain data, it is best used on the 1D timeframe for accurate readings.
* Real-time calculations may vary slightly due to different bar update behaviors.
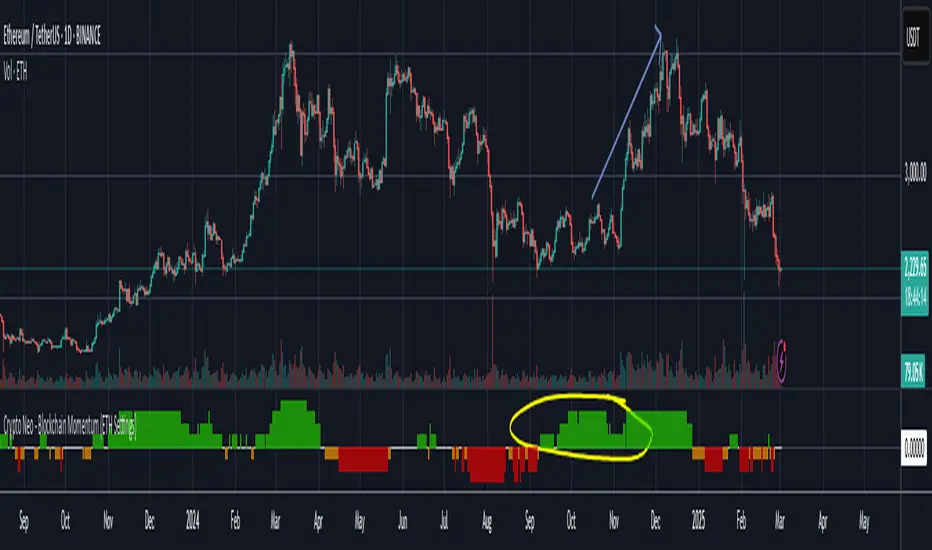
This indicator is very useful to confirm market turns early. Here are a few an example setups:
1. Back in 2022 on chain metrics started trending down after the market was consolidating at the top. On chain data predicted momentum moving to the downside.

2. Around October 2024, on-chain metrics showed bullish momentum while ETH was consolidating. It led to a rally in November.

This indicator is designed to track key blockchain data sources, such as:
Hash Rate
Active Addresses
Transactions per Second
Transfers per Second
Trader Behavior
Long-Term Holders (Cruisers)
Money Flow In/Out
Total Value Locked
It processes these inputs using various Moving Average (MA) types, including SMA, EMA, DMA, to generate a Bullish Momentum Score, which is visually displayed on the chart.
How to Use:
Select MA Type – Choose between SMA, EMA, MIXMA, or DMA to determine how moving averages are applied.
Set MA Lengths – Adjust MA1 Length and MA2 Length to define short-term vs. long-term trend comparison.
Customize Data Sources – Select different on-chain metrics for the indicator to analyze.
Interpret the Bullish Momentum Score:
🟢 Green (Strong Bullish Momentum) – Bullish on-chain signals dominate.
🟡 Yellow (Moderate Bullish Momentum) – Weak bullish trend forming.
⚪ White (Neutral) – No clear trend.
🟠 Orange (Moderate Bearish Momentum) – Weak bearish signals emerging.
🔴 Red (Strong Bearish Momentum) – Bearish on-chain signals dominate.
Important Notes
* This indicator does not generate trading signals but helps interpret blockchain trends for informed decision-making.
* Since it relies on daily on-chain data, it is best used on the 1D timeframe for accurate readings.
* Real-time calculations may vary slightly due to different bar update behaviors.
This indicator is very useful to confirm market turns early. Here are a few an example setups:
1. Back in 2022 on chain metrics started trending down after the market was consolidating at the top. On chain data predicted momentum moving to the downside.
2. Around October 2024, on-chain metrics showed bullish momentum while ETH was consolidating. It led to a rally in November.
受保護腳本
此腳本以閉源形式發佈。 不過,您可以自由使用,沒有任何限制 — 點擊此處了解更多。
Crypto Neo
📈 Algo Strategies | Market Signals
🔍 Data-Driven Edge for Traders
⚡ Developing high-performance trading systems
📢 Telegram 👉 t.me/cryptoNeo0x
📈 Algo Strategies | Market Signals
🔍 Data-Driven Edge for Traders
⚡ Developing high-performance trading systems
📢 Telegram 👉 t.me/cryptoNeo0x
免責聲明
這些資訊和出版物並非旨在提供,也不構成TradingView提供或認可的任何形式的財務、投資、交易或其他類型的建議或推薦。請閱讀使用條款以了解更多資訊。