OPEN-SOURCE SCRIPT
已更新 Bjorgum TSI
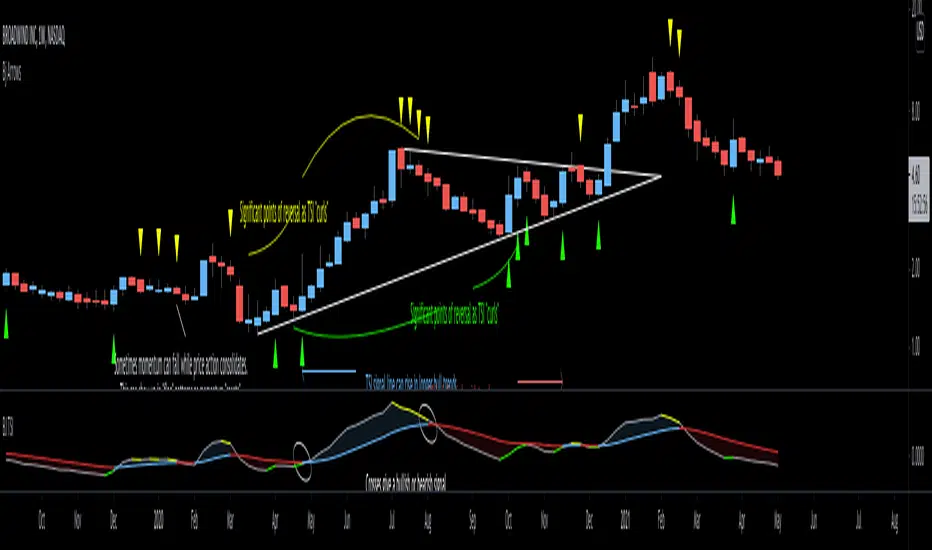
-This script utilizes simple color changes of the TSI output signals to aid in interpretation of the classic TSI indicator.
-Crosses of the TSI value line and signal line are a bullish or bearish indication. TSI value line is colored green or yellow to help identify that the TSI value line is either dropping or rising, while over or under the signal line.
-This can help anticipate a cross, or significant points in the trend. TSI signal line changes color when rising or falling which can help to identify larger prevailing trends.
-Generally, a rising signal line can be an overall bullish move, while falling more bearish regardless of crosses.
*Resolution function enables multiple overlay for "Multi-timeframe analysis"*
發行說明
Update includes some menu name changes and area plot fill color to accentuate bullish or bearish trends in the indicator 發行說明
ALL NEW CAPABILITYNew "Select-a-speed" option provides a drop down box to allow the user greater control over the inputs used for the indicator
-Preset values are present for dual speed control without having to remember values
-"Fast" gives timelier signals - quicker entries and exits, but may give more whipsaw signals. This setting is good for swing trading, etc.
-"Slow" gives less signals - More meaningful signals, less whipsaw, but will not catch the top or bottom quite as good leaving a little delay.
This setting may be better for longer holds, or more volatile assets
Experiment and have fun - Back test the strategy and use a speed that works well for your asset, timeframe, and trading style
ALSO INCLUDED
- By request - The ability to add overbought and oversold lines at your value of choice. Default is 25 and -25 and invisible.
*Activate checkbox in settings to see these lines if desired*
發行說明
Added alert functions:-Bullish/bearish crosses of TSI
-Generic cross for recurring alerts
-Alert for bullish or bearish "curl" - gives an alert where the TSI line is highlighted while curling toward the signal line
發行說明
ALL NEW UPDATESAdded new alert functions and bar color
Alert for overbought/oversold
- Alerts user as TSI value crosses the specified values in settings. (default 30 and -30)
- The technician should apply values to fit common extremes for their timeframe
Alert for Curl in area extreme
*Alerts user if TSI "curls" in overbought or oversold (above or below user defined values)
*Bar color option will also color based on this condition so the technician can visually check its effectiveness
Example of bar color check:
發行說明
Upgrade to version 5Added a zero line option from menu as frequently requested
Added multi-timeframe functionality utilizing the built-in args
發行說明
Updated settings menu to allow for manipulation of color variables from the input menu to combat deprecation of the transp argument 發行說明
Updated bar color options as per user request 發行說明
Colors are organized in the settings tab and now can be seen back in the style tab again. Transparency can be altered with the slider in the color menu發行說明
Upon request, an alert feature has been added to signal when crosses occur while the TSI is in the overbought and oversold zones. The threshold level at which these crosses must occur is set based on the values specified for overbought and oversold levels in the user menu. Additionally, a checkbox has been added to allow the choice to highlight the background where these crosses occur.發行說明
The code has been refactored and the user interface optimized for convenience. The update includes three color themes, each accessible from a dropdown menu:- Tropical theme: Combines teal and coral for fresh, vibrant, beachy vibes.
- Neon lights theme: Bright and dynamic with neon purple and blue, emulating city nightlife.
- Classic Bj: Offers a subtle yet contrasting palette that maintains the classic aesthetics of the original indicator.
開源腳本
本著TradingView的真正精神,此腳本的創建者將其開源,以便交易者可以查看和驗證其功能。向作者致敬!雖然您可以免費使用它,但請記住,重新發佈程式碼必須遵守我們的網站規則。
免責聲明
這些資訊和出版物並不意味著也不構成TradingView提供或認可的金融、投資、交易或其他類型的意見或建議。請在使用條款閱讀更多資訊。
開源腳本
本著TradingView的真正精神,此腳本的創建者將其開源,以便交易者可以查看和驗證其功能。向作者致敬!雖然您可以免費使用它,但請記住,重新發佈程式碼必須遵守我們的網站規則。
免責聲明
這些資訊和出版物並不意味著也不構成TradingView提供或認可的金融、投資、交易或其他類型的意見或建議。請在使用條款閱讀更多資訊。