PINE LIBRARY
已更新 arraybrowser
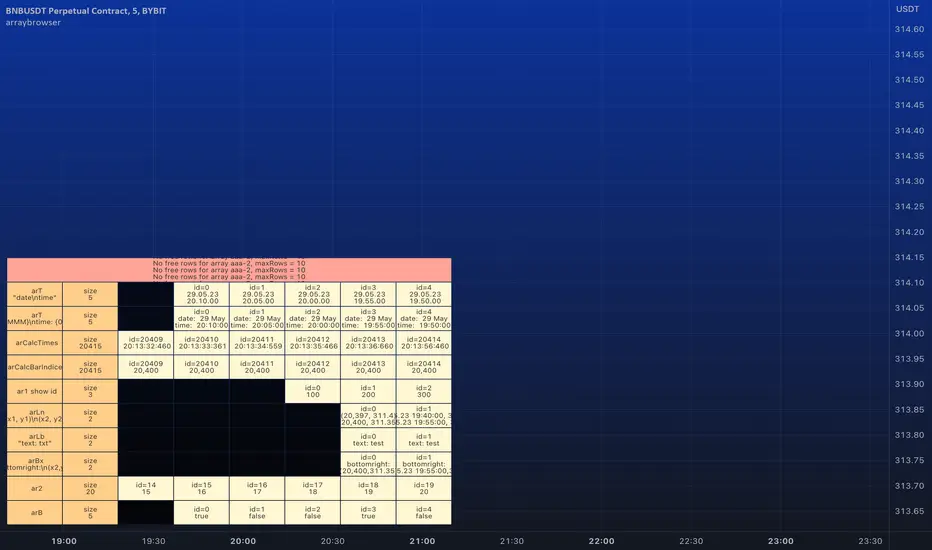
█ ARRAY BROWSER
Add you arrays to the array browser window and scroll them away left and right.
Flexible formatting options (see below).
Many thanks to kaigouthro for his beautiful matrixautotable library. (import kaigouthro/matrixautotable/14)
How to use
Copy the "ARRAY BROWSER" commented code section below to your script and uncomment.
See DEMO section in the library for usage examples.
Basically: add() your arrays and draw() on barstate.islast.
If your script adds the arrays every calculation do not forget to clear() before adding.
Otherwise, since the arrays are added by reference, no need to add them on every bar, every time you draw() the actual values are retrieved.
Up to 10 arrays of each type (float/string/line/label/box) are supported (total 50 arrays).
Change offset in the input settings to scroll left/right.
Usage example:
Pine Script®
Formatting options
For float/int you can always use format string like "{0, time, HH:mm:ss}" or "{0.00}".
Additional options are
- --- Number formats ---
- "number"
- "0"
- "0.0"
- "0.00"
- "0.000"
- "0.0000"
- "0.00000"
- "0.000000"
- "0.0000000"
- --- Date formats ---
- "date"
- "date : time"
- "dd.MM"
- "dd"
- --- Time formats ---
- "time"
- "HH:mm"
- "mm:ss"
- "date time"
- "date, time"
- "date,time"
- "date\time"
For line and box: Empty `format` returns coordinates as "(x1, y1) - (x2, y2)". Otherwise "x1", "x2", "y1", "y2" in `format` string are replaced by values. (e.g. toS(line, "x1, x2") will only return x1 and x2 separated by comma).
For label: Empty `format` returns coordinates and text as "(x, y): text = text". Otherwise "x1", "y1", "txt" in `format` string are replaced by values. (e.g. toS(label, "txt") will only return text of the label)
Add you arrays to the array browser window and scroll them away left and right.
Flexible formatting options (see below).
Many thanks to kaigouthro for his beautiful matrixautotable library. (import kaigouthro/matrixautotable/14)
How to use
Copy the "ARRAY BROWSER" commented code section below to your script and uncomment.
See DEMO section in the library for usage examples.
Basically: add() your arrays and draw() on barstate.islast.
If your script adds the arrays every calculation do not forget to clear() before adding.
Otherwise, since the arrays are added by reference, no need to add them on every bar, every time you draw() the actual values are retrieved.
Up to 10 arrays of each type (float/string/line/label/box) are supported (total 50 arrays).
Change offset in the input settings to scroll left/right.
Usage example:
import moebius1977/arraybrowser/1 as arraybrowser // this alias is used in the copied section, so better keep it
[...]
<COPIED "ARRAY BROWSER" SECTION>
[...]
arbr.clear() // clears all rows and deletes the table
arbr.add(arrayFloat, format = "0.00") // adds an array with title
arbr.add(arrayInt) // adds an array without title
arbr.add(arrayTimes, "array of times 1", "date\ntime") // format date and time so as to fit in the cell.
arbr.add(arrayTimes, "array of times 2", "{0, time, HH:mm}") // format date and time so as to fit in the cell.
arbr.add(arrayString) //
arbr.add(arrayLine, "arrayLines", "(x1, y1)\n(x2,y2)") // use your own format combining "x1", "y1", "x2", "y2"
arbr.add(arrayLabel, "arrayLabel", "txt") // only print label text, no coordinates
arbr.add(arrayBox, showIds = true) // show ID's for this array if input setting is "individually"
arbr.draw() // shows the table with arrays, use on barstate.islast
Formatting options
For float/int you can always use format string like "{0, time, HH:mm:ss}" or "{0.00}".
Additional options are
- --- Number formats ---
- "number"
- "0"
- "0.0"
- "0.00"
- "0.000"
- "0.0000"
- "0.00000"
- "0.000000"
- "0.0000000"
- --- Date formats ---
- "date"
- "date : time"
- "dd.MM"
- "dd"
- --- Time formats ---
- "time"
- "HH:mm"
- "mm:ss"
- "date time"
- "date, time"
- "date,time"
- "date\time"
For line and box: Empty `format` returns coordinates as "(x1, y1) - (x2, y2)". Otherwise "x1", "x2", "y1", "y2" in `format` string are replaced by values. (e.g. toS(line, "x1, x2") will only return x1 and x2 separated by comma).
For label: Empty `format` returns coordinates and text as "(x, y): text = text". Otherwise "x1", "y1", "txt" in `format` string are replaced by values. (e.g. toS(label, "txt") will only return text of the label)
發行說明
v2 Added support for bool arrays. Changing text color does not work temporarily.
發行說明
v3 A minor bug fix. (in deleteRow())發行說明
v4 Same amendment as above.發行說明
v5 Added support for varip arrays. Previous versions disrupted behaviour of varip arrays.Pine腳本庫
秉持 TradingView 一貫的共享精神,作者將此 Pine 程式碼發佈為開源庫,讓社群中的其他 Pine 程式設計師能夠重複使用。向作者致敬!您可以在私人專案或其他開源發佈中使用此庫,但在公開發佈中重複使用該程式碼需遵守社群規範。
免責聲明
這些資訊和出版物並不意味著也不構成TradingView提供或認可的金融、投資、交易或其他類型的意見或建議。請在使用條款閱讀更多資訊。
Pine腳本庫
秉持 TradingView 一貫的共享精神,作者將此 Pine 程式碼發佈為開源庫,讓社群中的其他 Pine 程式設計師能夠重複使用。向作者致敬!您可以在私人專案或其他開源發佈中使用此庫,但在公開發佈中重複使用該程式碼需遵守社群規範。
免責聲明
這些資訊和出版物並不意味著也不構成TradingView提供或認可的金融、投資、交易或其他類型的意見或建議。請在使用條款閱讀更多資訊。