OPEN-SOURCE SCRIPT
Optimized MTF Indicator
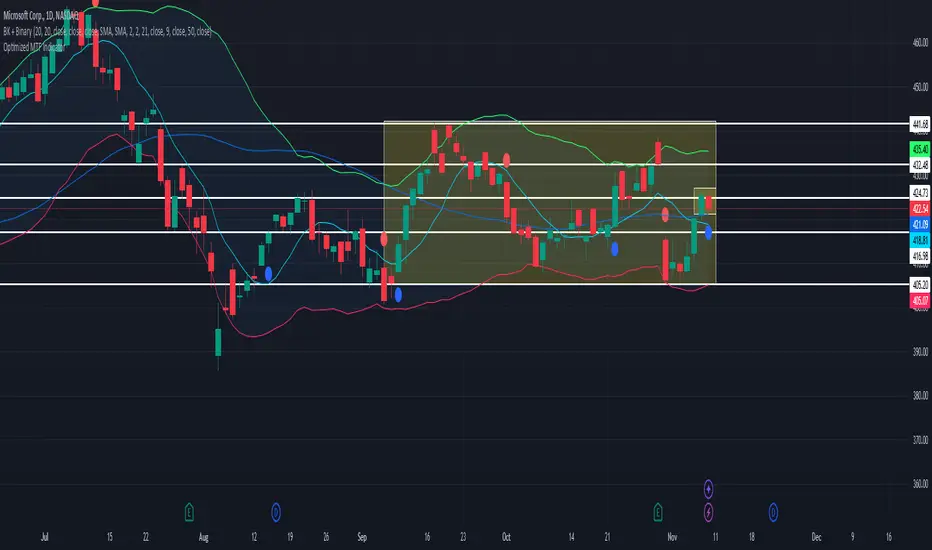
This Pine Script is a custom Multi-Timeframe (MTF) indicator that dynamically adjusts its analysis based on the current chart's timeframe. It calculates MACD crossovers for two different timeframes (a lower and a higher timeframe) and plots visual signals (colored circles) on the chart to indicate the crossovers. This can help traders make more informed decisions by providing insights from multiple timeframes.
The steps are as follows:
The current chart's timeframe is used to dynamically set corresponding lower and higher timeframes.
MACD analysis (with crossovers) is performed for both the lower and higher timeframes.
Visual signals (colored circles) are plotted to indicate the MACD crossovers on both timeframes, helping traders spot potential buy (bullish) or sell (bearish) signals.
開源腳本
秉持TradingView一貫精神,這個腳本的創作者將其設為開源,以便交易者檢視並驗證其功能。向作者致敬!您可以免費使用此腳本,但請注意,重新發佈代碼需遵守我們的社群規範。
免責聲明
這些資訊和出版物並非旨在提供,也不構成TradingView提供或認可的任何形式的財務、投資、交易或其他類型的建議或推薦。請閱讀使用條款以了解更多資訊。
開源腳本
秉持TradingView一貫精神,這個腳本的創作者將其設為開源,以便交易者檢視並驗證其功能。向作者致敬!您可以免費使用此腳本,但請注意,重新發佈代碼需遵守我們的社群規範。
免責聲明
這些資訊和出版物並非旨在提供,也不構成TradingView提供或認可的任何形式的財務、投資、交易或其他類型的建議或推薦。請閱讀使用條款以了解更多資訊。