OPEN-SOURCE SCRIPT
已更新 MTF Pivot Zones
## 📘 **User Guide: MTF Pivot Zones**
**Script Name:** MTF Pivot Zones
Multi Time Frame Pivot
---
### 🧭 Overview
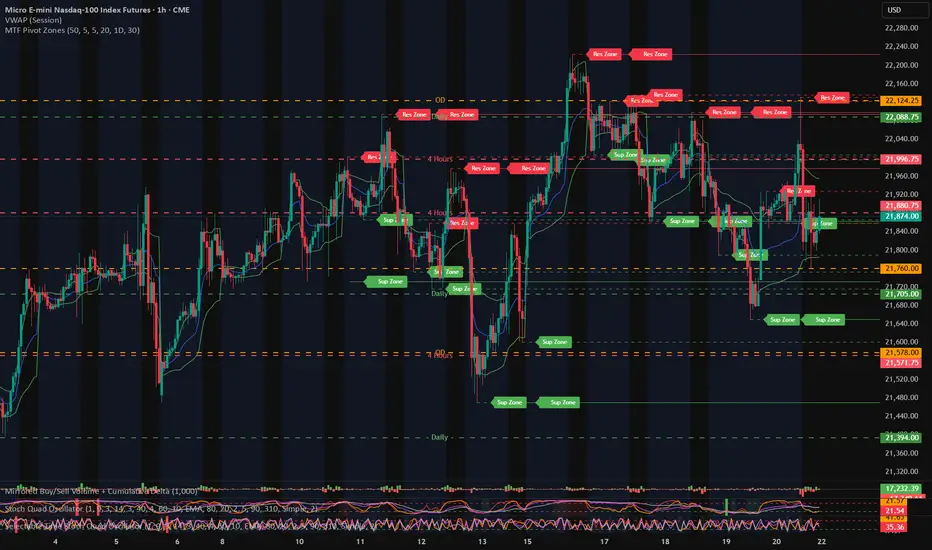
**MTF Pivot Zones** is a multi-timeframe analysis tool that detects and merges swing highs and lows across four key timeframes:
**Weekly, Daily, 4H, and 1H**.
It plots clear **Support** and **Resistance** zones on the chart based on pivot point clustering. Zones are displayed as dashed lines, color-coded by type.
---
### ⚙️ Settings
| Input Name | Description |
| ---------------------- | --------------------------------------------------------------------- |
| `Lookback Bars Per TF` | Number of bars to scan for pivot highs/lows per timeframe |
| `Pivot Left Bars` | Number of bars to the left required to confirm a pivot |
| `Pivot Right Bars` | Number of bars to the right required to confirm a pivot |
| `Merge Tolerance ($)` | Distance threshold in dollars to merge nearby pivot levels into zones |
| `Show TF Labels` | Toggle the text label next to each zone (e.g., “Res Zone”) |
---
### 🛠️ How It Works
1. **Pivot Detection**
The script scans each timeframe using `ta.pivothigh()` and `ta.pivotlow()`.
2. **Zone Merging**
Pivot levels within the specified `Merge Tolerance` are averaged and treated as a single zone.
3. **Zone Plotting**
* **Red dashed lines** = Resistance Zones
* **Green dashed lines** = Support Zones
* Optional labels show zone type if `Show TF Labels` is enabled
---
### 📈 Usage Tips
* Use zones to guide entries, exits, and stop-loss placement.
* Combine with trend tools or candlestick confirmation near zones.
* Adjust merge tolerance to match instrument volatility and timeframe.
---
Let me know if you want this formatted for **TradingView publishing**, or included in a `study()` title block comment.
發行說明
## 🧭 MTF Pivot Zones – User Guide
**Purpose:**
The **MTF Pivot Zones** indicator automatically detects and displays key support and resistance zones using multiple timeframes and price gaps. It's designed for traders who manually plan trades around historically reactive price levels.
---
### 🔍 What It Does
This indicator:
* **Scans multiple timeframes** (`Weekly`, `Daily`, `4H`, `1H`) for pivot highs and lows.
* **Identifies gap levels** where price opened with a gap up or down from the previous candle's high or low.
* **Merges nearby levels** based on a user-defined dollar tolerance to form clean, consolidated zones.
* **Plots zones** as dashed lines on the chart.
* **Optionally adds labels** next to each zone to indicate its origin (support or resistance).
---
### ⚙️ Inputs & Settings
#### 📌 General Settings
* **Lookback Bars Per TF**: Number of bars to evaluate for pivots per timeframe.
* **Pivot Left/Right Bars**: Sensitivity of pivot detection; higher values filter smaller swings.
* **Merge Tolerance (\$)**: Distance in dollars within which nearby levels are merged.
* **Show TF Labels**: Display or hide zone labels on the chart.
#### 📈 Gap Detection Settings
* **Enable Gap Level Detection**: Turns gap-based level detection on or off.
* **Gap Detection Timeframe**: Timeframe used to detect gaps (default: Daily).
* **Gap Detection Lookback**: How many bars back to check for gaps.
---
### 🖥️ What You See on the Chart
* **Green Dashed Lines**: Merged support zones (from lows or gap-up events).
* **Red Dashed Lines**: Merged resistance zones (from highs or gap-down events).
* **Optional Labels**: Show `"Sup Zone"` or `"Res Zone"` near each level for clarity.
---
### 📌 Use Cases
* Identify high-probability bounce or breakout areas.
* Mark key zones for alerts, manual trade entries, or stop-loss placement.
* Combine with your own strategy (price action, indicators, or volume).
開源腳本
秉持TradingView一貫精神,這個腳本的創作者將其設為開源,以便交易者檢視並驗證其功能。向作者致敬!您可以免費使用此腳本,但請注意,重新發佈代碼需遵守我們的社群規範。
免責聲明
這些資訊和出版物並非旨在提供,也不構成TradingView提供或認可的任何形式的財務、投資、交易或其他類型的建議或推薦。請閱讀使用條款以了解更多資訊。
免責聲明
這些資訊和出版物並非旨在提供,也不構成TradingView提供或認可的任何形式的財務、投資、交易或其他類型的建議或推薦。請閱讀使用條款以了解更多資訊。