PROTECTED SOURCE SCRIPT
COINCIYIZ CROSSOVER 1.1
A crossover is used by a technical analyst to forecast how a stock will perform in the near future. For most models, the crossover signals that it’s time to either buy or sell the underlying asset. Investors use crossovers along with other indicators to track things like turning points, price trends and money flow.
Crossovers indicating a moving average are generally the cause of breakouts and breakdowns. Moving averages can determine a change in the price trend based on the crossover. For example, a technique for trend reversal is using a five-period simple moving average along with a 9/21-period simple moving average. A crossover between the two will signal a reversal in trend, or a breakout or breakdown.
A breakout would be indicated by the five-period moving average crossing up through the 21-period. This is also indicative of an uptrend, which is made of higher highs and lows. A breakdown would be indicated by the five-period moving average crossing down through the 9/21-period. This is also indicative of a downtrend, composed of lower highs and lows.
Longer time frames result in stronger signals. For example, a daily chart carries more weight than a one-minute chart. Conversely, the shorter time frames give earlier indicators, but they are also susceptible to false signals as well.
(R: investopedia)
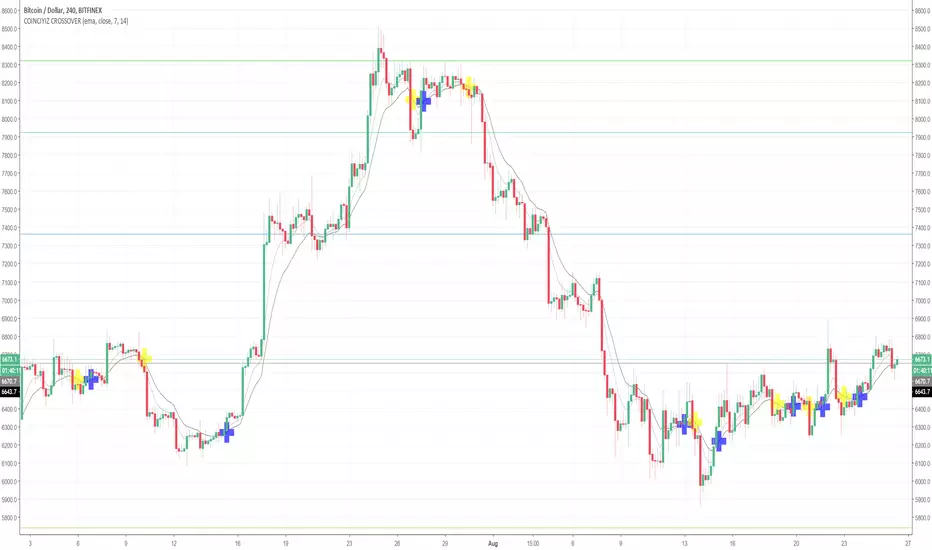
Short signal - Yellow
Long signal - Blue
Crossovers indicating a moving average are generally the cause of breakouts and breakdowns. Moving averages can determine a change in the price trend based on the crossover. For example, a technique for trend reversal is using a five-period simple moving average along with a 9/21-period simple moving average. A crossover between the two will signal a reversal in trend, or a breakout or breakdown.
A breakout would be indicated by the five-period moving average crossing up through the 21-period. This is also indicative of an uptrend, which is made of higher highs and lows. A breakdown would be indicated by the five-period moving average crossing down through the 9/21-period. This is also indicative of a downtrend, composed of lower highs and lows.
Longer time frames result in stronger signals. For example, a daily chart carries more weight than a one-minute chart. Conversely, the shorter time frames give earlier indicators, but they are also susceptible to false signals as well.
(R: investopedia)
Short signal - Yellow
Long signal - Blue
受保護腳本
此腳本以閉源形式發佈。 不過,您可以自由使用,沒有任何限制 — 點擊此處了解更多。
免責聲明
這些資訊和出版物並非旨在提供,也不構成TradingView提供或認可的任何形式的財務、投資、交易或其他類型的建議或推薦。請閱讀使用條款以了解更多資訊。
受保護腳本
此腳本以閉源形式發佈。 不過,您可以自由使用,沒有任何限制 — 點擊此處了解更多。
免責聲明
這些資訊和出版物並非旨在提供,也不構成TradingView提供或認可的任何形式的財務、投資、交易或其他類型的建議或推薦。請閱讀使用條款以了解更多資訊。