OPEN-SOURCE SCRIPT
Multiple Timeframe continuity with Crossover Alerts
█ OVERVIEW
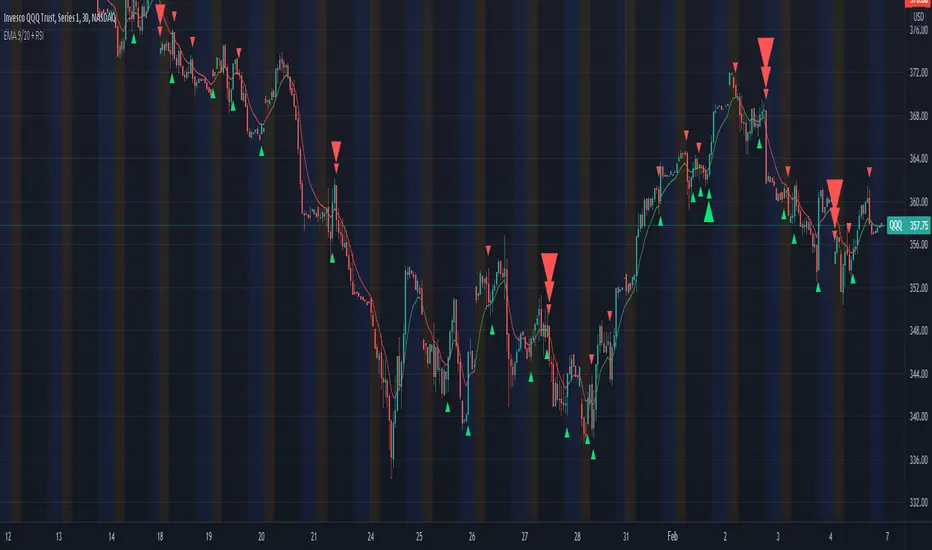
This Indicator calculates the EMA 9/20 and the RSI with its SMA on multiple timeframes and indicates their crossings. In addition this script alerts the user when crossings appear.
█ USAGE
Use the checkboxes to activate different timeframes. With the dropdown menu you can select the timeframe in minutes.
Furthermroie use the checkboxes to activate different crossovers. At the end of the settings you can find the same options for the RSI.
You can also let the script indicate only the overlapping of both indicator crossovers by using the combination option.
█ KNOWLEDGE
EMA: The ema function returns the exponentially weighted moving average. In ema weighting factors decrease exponentially. It calculates by using a formula: EMA = alpha * source + (1 - alpha) * EMA[1], where alpha = 2 / (length + 1).
SMA: The sma function returns the moving average, that is the sum of last y values of x, divided by y.
RSI: The RSI is classified as a momentum oscillator, measuring the velocity and magnitude of price movements. Momentum is the rate of the rise or fall in price. The RSI computes momentum as the ratio of higher closes to lower closes: stocks which have had more or stronger positive changes have a higher RSI than stocks which have had more or stronger negative changes.
RMA: Moving average used in RSI. It is the exponentially weighted moving average with alpha = 1 / length.
(Source: TradingView PineScript reference & en.wikipedia.org/wiki/Relative_strength_index)
█ Credits
Thanks to KhanPhelan with his EMA 9/20 trading idea
Credits to TradingView for their RSI function
█ Disclaimer
This is my first Script, any feedback is welcome.
開源腳本
秉持TradingView一貫精神,這個腳本的創作者將其設為開源,以便交易者檢視並驗證其功能。向作者致敬!您可以免費使用此腳本,但請注意,重新發佈代碼需遵守我們的社群規範。
免責聲明
這些資訊和出版物並非旨在提供,也不構成TradingView提供或認可的任何形式的財務、投資、交易或其他類型的建議或推薦。請閱讀使用條款以了解更多資訊。
免責聲明
這些資訊和出版物並非旨在提供,也不構成TradingView提供或認可的任何形式的財務、投資、交易或其他類型的建議或推薦。請閱讀使用條款以了解更多資訊。