OPEN-SOURCE SCRIPT
已更新 Realized Price Profit/Loss Margin [VWAP Optimized]
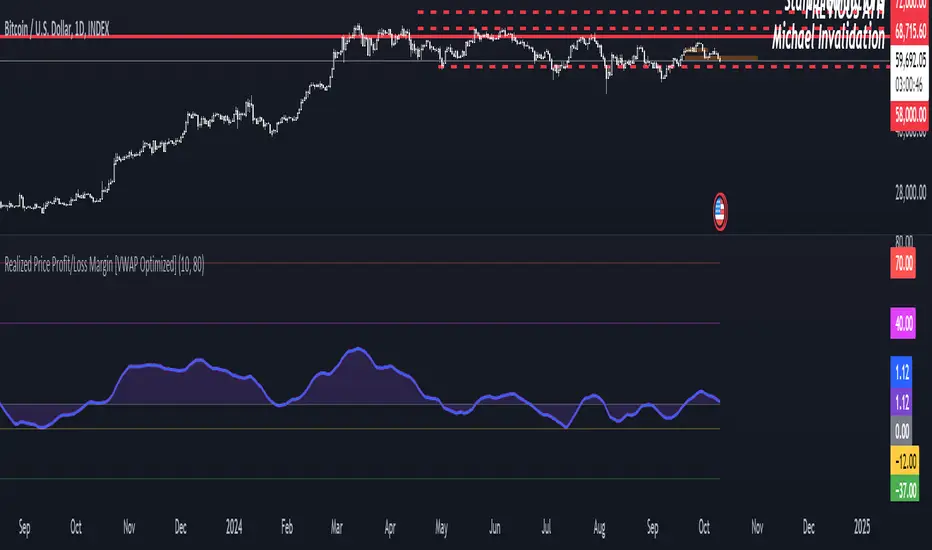
Shaded Profit/Loss Margin Oscillator
The Shaded Profit/Loss Margin Oscillator is a powerful tool designed to measure Bitcoin’s Net Unrealized Profit/Loss (NUPL). This metric reflects the difference between Bitcoin’s current market price and its realized price, which approximates the price at which coins were last moved. By smoothing the NUPL using a moving average, the indicator provides a clean purple oscillator line that helps users easily gauge market sentiment. When the oscillator is above the zero line, the market is in profit, and when it is below zero, participants are generally in a state of unrealized loss. The shaded area between the oscillator and the zero line enhances visual clarity, making it easier to identify potential shifts in market behavior such as profit-taking or capitulation.
Unique Features and Added Value
What sets this indicator apart from traditional NUPL indicators is the use of a volume-weighted average price (VWAP) as a proxy for the realized price. Unlike the original on-chain NUPL metric, which relies on complex on-chain data, this indicator leverages VWAP to provide an approximation of realized price based solely on price and volume data available directly on TradingView. This method makes it highly accessible to traders who don’t have access to on-chain data platforms.
The use of VWAP not only simplifies the calculation but also provides additional value, as it incorporates volume into the realized price estimation. This volume-sensitive approach may offer a more responsive and dynamic reflection of realized prices compared to on-chain models, which can sometimes lag. In essence, this VWAP-based NUPL oscillator offers a unique edge in tracking profit/loss margins, particularly for traders who want a straightforward and efficient way to gauge sentiment without relying on external on-chain data sources. It brings the essence of NUPL into the world of technical analysis in an accessible and actionable way.
發行說明
Update to UI開源腳本
秉持TradingView一貫精神,這個腳本的創作者將其設為開源,以便交易者檢視並驗證其功能。向作者致敬!您可以免費使用此腳本,但請注意,重新發佈代碼需遵守我們的社群規範。
免責聲明
這些資訊和出版物並非旨在提供,也不構成TradingView提供或認可的任何形式的財務、投資、交易或其他類型的建議或推薦。請閱讀使用條款以了解更多資訊。
免責聲明
這些資訊和出版物並非旨在提供,也不構成TradingView提供或認可的任何形式的財務、投資、交易或其他類型的建議或推薦。請閱讀使用條款以了解更多資訊。