OPEN-SOURCE SCRIPT
已更新 H/L Price Band with Signal Line (PBS)
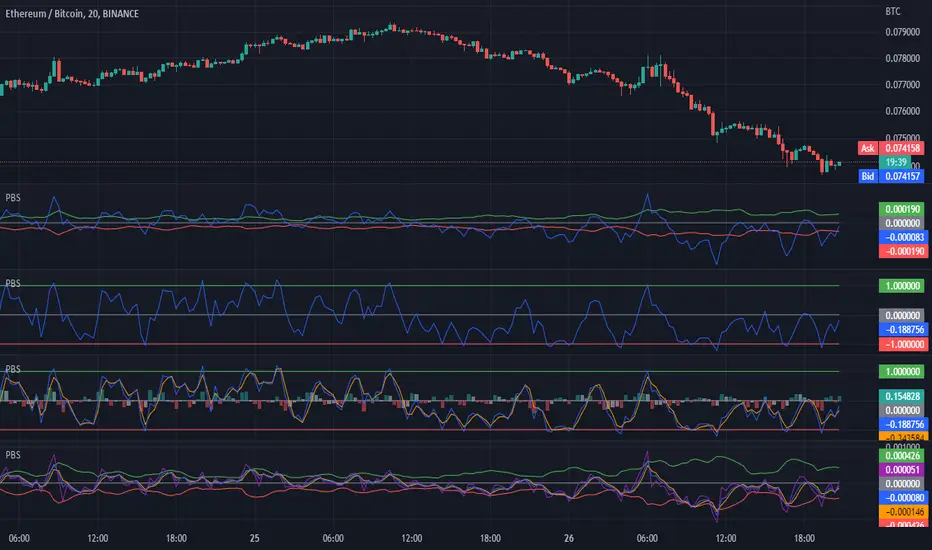
This indicator centers a moving average around the hl2 of the price. This is calculated as the difference of two moving averages. The upper band is a 9 period exponential moving average, the lower band is a 7 period moving average and the center line is the average between the two. The "Fast Line" is our signal line in this oscillator. When the price is hovering around the center of the band this indicates that a trend is pausing or reversing. When the fast line exits the band this could be a buy or sell signal. It could also indicate a very strong trend in that direction. To get the optimal entry and exit you might want to wait for the price to return to the center line. In addition to the basic functionality of this indicator I have added some bonus features. You can enable the "Slow Line" or the "Long Line" to enhance your signals. When the fast line is above the slow/long line you are in an up trend and inversely when the fast line is below the slow/long line you are in a down trend. The crossing of these lines can indicate a reversal. I have also included a "J" style amplification line. This works by enhancing the difference between the Fast and Slow/Long line to make it more visually apparent. You can also configure the "J" line to be calculated between either the slow or long line. Finally I have added the feature to amplify the band width by the standard deviation. This is set to 1 by default but you can also get a more responsive signal by setting this to 0.
This indicator works in most markets. There is a tool tip for every aspect of this indicator explaining how everything works. I hope you are very profitable with this one!
If you find this indicator is useful to you, Star it, Follow, Donate, Like and Share.
Your support is a highly motivation for me.
發行說明
Fixed the default stdev發行說明
Changed a default background colour to make things more visible when using both backgrounds. 發行說明
Updated tool tip...發行說明
ease of use fix發行說明
Update default發行說明
minor fix發行說明
Minor tool tip fix發行說明
Fixed the "J" line colour.發行說明
Updated tool tips. 發行說明
Fresh refactor. Let me know if you want any of the old feature back. I added normalization and a convergence divergence histogram. I removed the background colors and the ability to change the sources. Lead and Lag line are HL2, high line is High and low line is Low. It still works the same as always.To recap the function, this indicator lets you see where the live price is relative to the average high and low. You can also multiply the band by a standard deviation to give you a real time Bollinger band oscillator that uses the average high and low instead of the mean.
Enjoy and let me know if you want any features back.
發行說明
I also removed the extra lsma line.發行說明
TransitMan suggested this feature.Added pivots
發行說明
quick fix like usual開源腳本
本著TradingView的真正精神,此腳本的創建者將其開源,以便交易者可以查看和驗證其功能。向作者致敬!雖然您可以免費使用它,但請記住,重新發佈程式碼必須遵守我們的網站規則。
免責聲明
這些資訊和出版物並不意味著也不構成TradingView提供或認可的金融、投資、交易或其他類型的意見或建議。請在使用條款閱讀更多資訊。
開源腳本
本著TradingView的真正精神,此腳本的創建者將其開源,以便交易者可以查看和驗證其功能。向作者致敬!雖然您可以免費使用它,但請記住,重新發佈程式碼必須遵守我們的網站規則。
免責聲明
這些資訊和出版物並不意味著也不構成TradingView提供或認可的金融、投資、交易或其他類型的意見或建議。請在使用條款閱讀更多資訊。