PROTECTED SOURCE SCRIPT
% Asian Liquidity
Description:
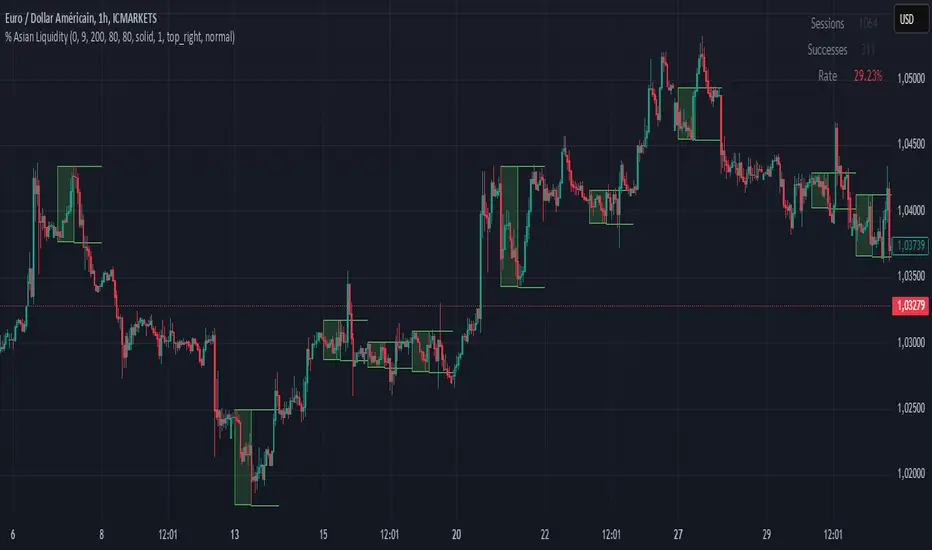
This indicator calculates the percentage of sessions in which the Asian session’s range is breached from above or below. It monitors the session’s high and low levels during the designated Asian session and then tracks subsequent price action to determine if these levels are broken. The visual display includes boxes outlining the session range and extended horizontal lines that adjust based on price movement. Additionally, a statistics table provides a clear summary of the breach frequency over time.
Key Features:
Usage:
This indicator calculates the percentage of sessions in which the Asian session’s range is breached from above or below. It monitors the session’s high and low levels during the designated Asian session and then tracks subsequent price action to determine if these levels are broken. The visual display includes boxes outlining the session range and extended horizontal lines that adjust based on price movement. Additionally, a statistics table provides a clear summary of the breach frequency over time.
Key Features:
- Detects the start and end of the Asian session based on user-defined hours.
- Records and monitors the session’s high and low levels.
- Draws visual boxes and extended lines on the chart for easy reference.
- Displays a statistics table summarizing the percentage of sessions with breaches.
Usage:
- Customize session times, colors, and line styles to suit your trading preferences.
- Use the visual cues and statistics table to assess how often the Asian session range is challenged.
- Apply this information to enhance your market analysis and trading decisions.
受保護腳本
此腳本以閉源形式發佈。 不過,您可以自由使用,沒有任何限制 — 點擊此處了解更多。
免責聲明
這些資訊和出版物並非旨在提供,也不構成TradingView提供或認可的任何形式的財務、投資、交易或其他類型的建議或推薦。請閱讀使用條款以了解更多資訊。
免責聲明
這些資訊和出版物並非旨在提供,也不構成TradingView提供或認可的任何形式的財務、投資、交易或其他類型的建議或推薦。請閱讀使用條款以了解更多資訊。