PROTECTED SOURCE SCRIPT
Customizable MTF POC (VWAP Approx)
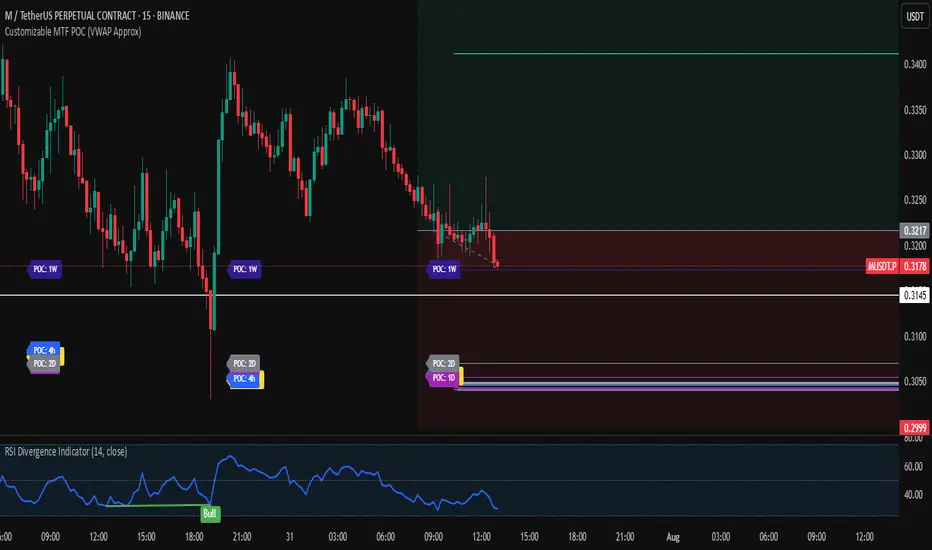
🔍 Multi-Timeframe VWAP POC Zones
This script displays volume-weighted average price (VWAP) levels from multiple timeframes on a single chart. Each VWAP level acts as a potential dynamic support or resistance zone, depending on the price action.
✅ Customizable timeframes included:
1m, 5m, 15m, 1h, 2h, 4h, 1D, 2D, 1W, 1M
📌 Key Features:
– VWAP lines per timeframe with adjustable visibility
– Color-coded for clarity
– Useful for identifying high-confluence support/resistance zones
📈 Usage Tip:
Combine this indicator with price action or liquidity zones for more accurate entries. Confluent VWAP zones across multiple timeframes often signal strong reaction areas.
⚠️ Note: This script uses VWAP as an approximation for Point of Control (POC). It does not rely on true volume profile histograms due to Pine Script limitations. For full volume profile analysis, use TradingView’s built-in “Fixed Range Volume Profile” tool.
受保護腳本
此腳本以閉源形式發佈。 不過,您可以自由使用,沒有任何限制 — 點擊此處了解更多。
免責聲明
這些資訊和出版物並非旨在提供,也不構成TradingView提供或認可的任何形式的財務、投資、交易或其他類型的建議或推薦。請閱讀使用條款以了解更多資訊。
免責聲明
這些資訊和出版物並非旨在提供,也不構成TradingView提供或認可的任何形式的財務、投資、交易或其他類型的建議或推薦。請閱讀使用條款以了解更多資訊。