PROTECTED SOURCE SCRIPT
Point of Control + Momentum Candles
POINT OF CONTROL + MOMENTUM CANDLES
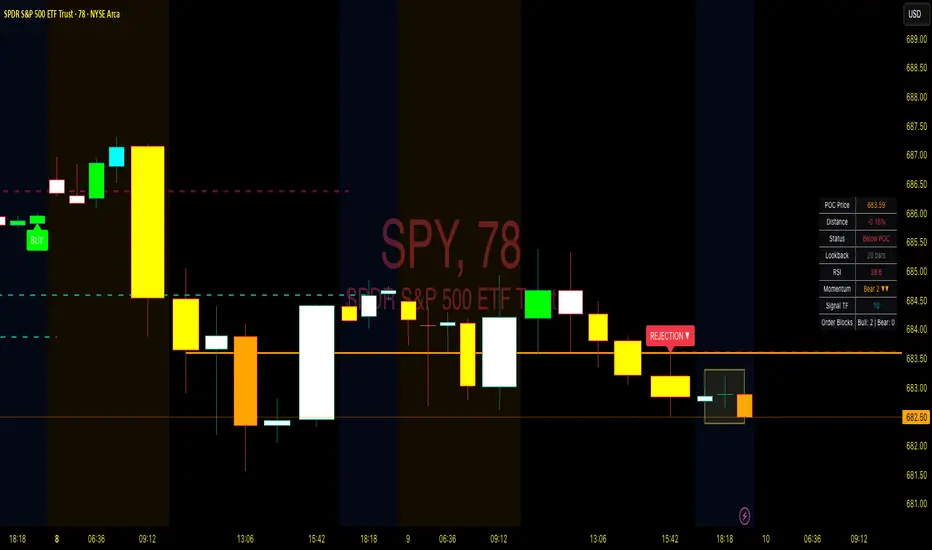
A multi-feature indicator combining volume-based POC detection, 6-level momentum candle coloring, higher timeframe buy/sell signals, and order block identification.
FEATURES
Point of Control (POC)
Calculates the price level with highest traded volume over a customizable lookback period. Includes break and rejection detection with visual signals.
Momentum Candle Coloring
Colors candles based on EMA positioning and RSI values across 6 momentum levels:
- Bull 3/2/1: Strong to weak bullish momentum (Blue/Cyan/Green)
- Bear 1/2/3: Weak to strong bearish momentum (Yellow/Orange/Red)
- Neutral: No clear momentum (White)
Buy/Sell Signals
Generates signals from a user-selectable timeframe using EMA crossovers and RSI conditions. Signals appear on your current chart for multi-timeframe analysis.
Order Blocks
Detects potential institutional entry zones:
- Bullish OB: Last bearish candle before bullish impulse
- Bearish OB: Last bullish candle before bearish impulse
Blocks extend forward and optionally delete when mitigated.
Dashboard
Displays POC price, distance, RSI, momentum level, signal timeframe, and active order block count.
ALERTS
10 conditions available: POC breaks, rejections, buy/sell signals, and order block formations.
HOW TO USE
- Trade POC breaks for trend continuation
- Trade POC rejections for reversals
- Use candle colors to gauge momentum strength
- Confirm entries with higher timeframe signals
- Watch for price returning to order blocks
SETTINGS
All parameters are fully customizable including lookback periods, thresholds, timeframes, colors, and visual styles.
DISCLAIMER
For educational purposes only. Not financial advice. Trading involves risk. Always conduct your own analysis before making trading decisions.
受保護腳本
此腳本以閉源形式發佈。 不過,您可以自由使用,沒有任何限制 — 點擊此處了解更多。
MARK N. ROGERS, MBA
Rogers1906.com
Rogers1906.com
免責聲明
這些資訊和出版物並非旨在提供,也不構成TradingView提供或認可的任何形式的財務、投資、交易或其他類型的建議或推薦。請閱讀使用條款以了解更多資訊。
受保護腳本
此腳本以閉源形式發佈。 不過,您可以自由使用,沒有任何限制 — 點擊此處了解更多。
MARK N. ROGERS, MBA
Rogers1906.com
Rogers1906.com
免責聲明
這些資訊和出版物並非旨在提供,也不構成TradingView提供或認可的任何形式的財務、投資、交易或其他類型的建議或推薦。請閱讀使用條款以了解更多資訊。