INVITE-ONLY SCRIPT
已更新 DepthHouse - Support and Resistance Indicator

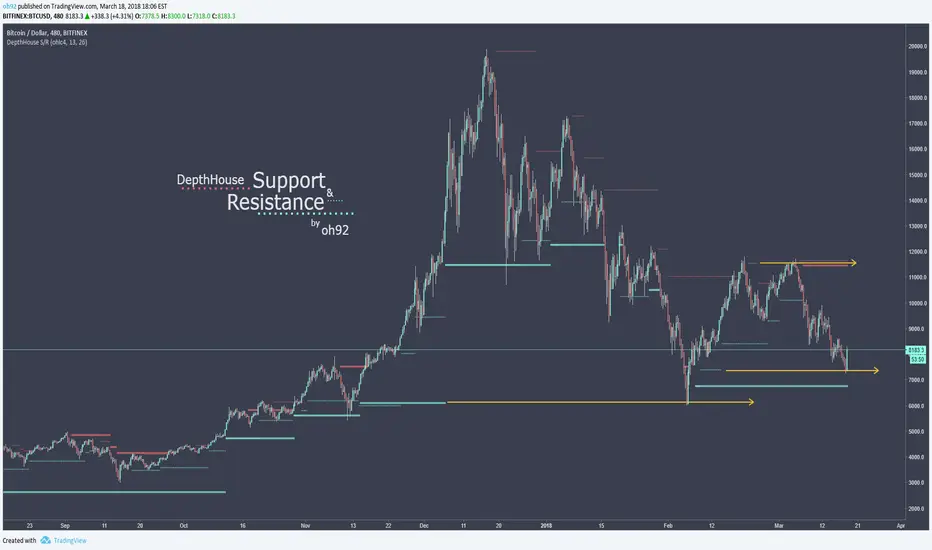
Depth House Support & Resistance Indicator is a custom trading tool designed to help traders locate possible support and resistance levels on stocks, cryptocurrencies, and all forex pairs.
A fantastic tool on all time frames.
Here is a video which I give a brief overview and show it in action:
youtu.be/fXvSWl6ykdM
How it works:
Based on the default settings, the ticker dots represent strong support and resistance while the smaller lines tend to represent weaker support/resistance.
As shown on the chart above, even after a line stops plotting, it still serves as possible support and/or resistance.
Changing the settings completely alters the support lines, so adjust and find what works best for you!
How to get:
As you can see this is an invite only script. In the coming months this indicator, along with many others will become pay to use only. (website on my profile page)
However all my indicators will be FREE until May 1, 2018. So please try them out!
To take advantage of this FREE trial:
1. Subscribe to my YouTube channel. I have many more videos to come! Maybe even leave a comment of what you would like to see next!
2. Comment on this indicator post! Maybe even give me a follow :D
I hope you all enjoy!!
Indicator website: depthhouse.com/
發行說明
Now support and resistance lines will alternate colors as the closing price crosses them.Creator of DepthHouse Indicators on TradingView!
↣ depthhouse.com/
↣ depthhouse.com/
免責聲明
這些資訊和出版物並非旨在提供,也不構成TradingView提供或認可的任何形式的財務、投資、交易或其他類型的建議或推薦。請閱讀使用條款以了解更多資訊。
Creator of DepthHouse Indicators on TradingView!
↣ depthhouse.com/
↣ depthhouse.com/
免責聲明
這些資訊和出版物並非旨在提供,也不構成TradingView提供或認可的任何形式的財務、投資、交易或其他類型的建議或推薦。請閱讀使用條款以了解更多資訊。