PROTECTED SOURCE SCRIPT
Amt TDI S2 Pattern
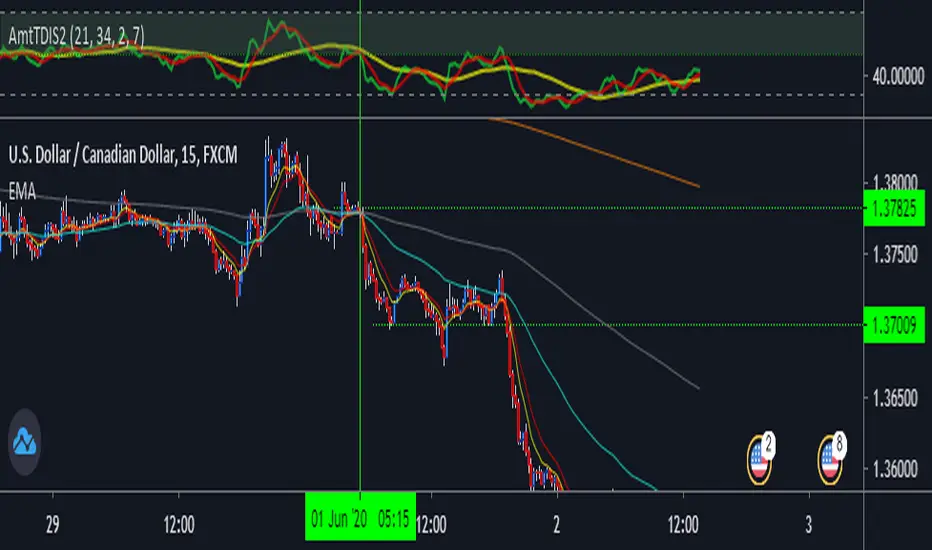
Yellow line-Liquid 50
Green Line-RSI
Red Line-Trend line
You can use it best on 15 min & 5min chart specially for intraday.
Buy Conditions-
: When yellow line is above green zone or 50.
:Green & Red line should cross or above yellow line. Green line should be above redline.
Sell Conditions-
: When yellow line is below green zone or 50.
:Green & Red line should cross or below yellow line. Green line should be below redline.
For better accuracy use it with EMA's.
NOTE- Dont use this strategy when market is sideways or very much volatile.
受保護腳本
此腳本以閉源形式發佈。 不過,您可以自由使用,沒有任何限制 — 點擊此處了解更多。
免責聲明
這些資訊和出版物並非旨在提供,也不構成TradingView提供或認可的任何形式的財務、投資、交易或其他類型的建議或推薦。請閱讀使用條款以了解更多資訊。
受保護腳本
此腳本以閉源形式發佈。 不過,您可以自由使用,沒有任何限制 — 點擊此處了解更多。
免責聲明
這些資訊和出版物並非旨在提供,也不構成TradingView提供或認可的任何形式的財務、投資、交易或其他類型的建議或推薦。請閱讀使用條款以了解更多資訊。