INVITE-ONLY SCRIPT
Bitcoin: Dips During Bullrun
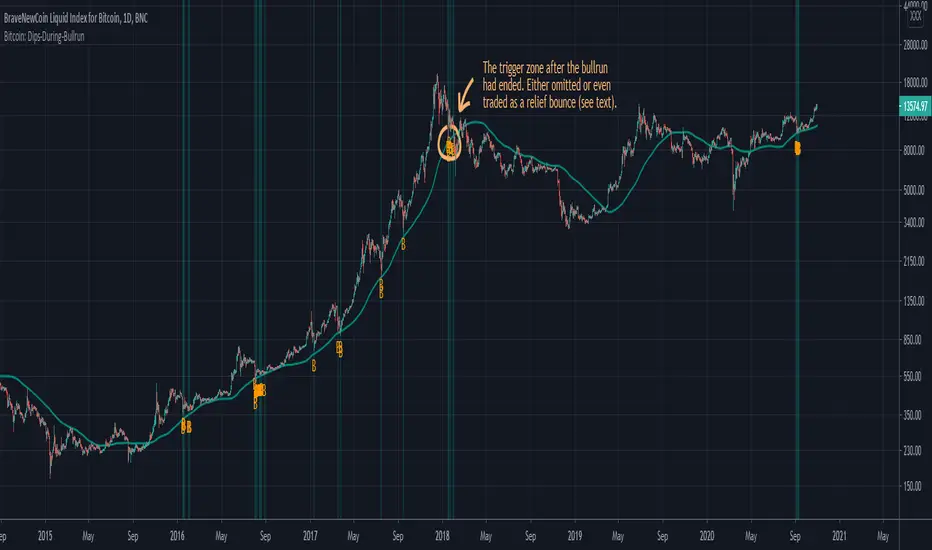
This script is designed to show dips during Bitcoin bull markets, assuming that Bitcoin finds its local low points in that market phase mostly around the MA(20W=140D) while having a low RSI value. Some other condition is also used to really only trigger after a distinct uptrend has begun. This indicator should only be used on the daily (D) timeframe, and preferably for the BraveNewCoin Liquid Index for Bitcoin (BLX). It's mostly for convenience as people could also just track the MA and the RSI closely, and additionally watch for evidence of a starting bull market. It is yet to be seen if Bitcoin really finds its local bottoms in this bull cycle based on those rules, but the latest price action looks promising. The indicator triggered a few weeks ago, so that the start of the next parabolic run of Bitcoin might be just around the corner.
Note that this algorithm is rather rudimentary, and it will also trigger in one more zone after the bullrun has already ended (marked on the chart above), as the first retest of the MA(20W) shows similar behaviour in the RSI as during bullrun dips. However with other indicators DeanTrader provides (as e.g. the "Bitcoin: Price Action Integrals", and the "Bitcoin: Top & Bottom Mini-Algo" indicators), it should be possible to determine when the bullrun has roughly ended to then discard this indicator until the next bull phase starts sometime in the future. Also some people might even want to trade the relief bounce based on that after-bullrun trigger.
You can hide the MA, as well as the green overlay and/or the plotted "B"s, if you only want to see some part of this indicator on your chart.
For access please contact me via DM on TradingView or on Twitter (linked on my TradingView profile and in my signature).
僅限邀請腳本
僅作者批准的使用者才能訪問此腳本。您需要申請並獲得使用許可,通常需在付款後才能取得。更多詳情,請依照作者以下的指示操作,或直接聯絡Dean_Trader。
TradingView不建議在未完全信任作者並了解其運作方式的情況下購買或使用腳本。您也可以在我們的社群腳本中找到免費的開源替代方案。
作者的說明
免責聲明
這些資訊和出版物並非旨在提供,也不構成TradingView提供或認可的任何形式的財務、投資、交易或其他類型的建議或推薦。請閱讀使用條款以了解更多資訊。
僅限邀請腳本
僅作者批准的使用者才能訪問此腳本。您需要申請並獲得使用許可,通常需在付款後才能取得。更多詳情,請依照作者以下的指示操作,或直接聯絡Dean_Trader。
TradingView不建議在未完全信任作者並了解其運作方式的情況下購買或使用腳本。您也可以在我們的社群腳本中找到免費的開源替代方案。
作者的說明
免責聲明
這些資訊和出版物並非旨在提供,也不構成TradingView提供或認可的任何形式的財務、投資、交易或其他類型的建議或推薦。請閱讀使用條款以了解更多資訊。