OPEN-SOURCE SCRIPT
Double EMA
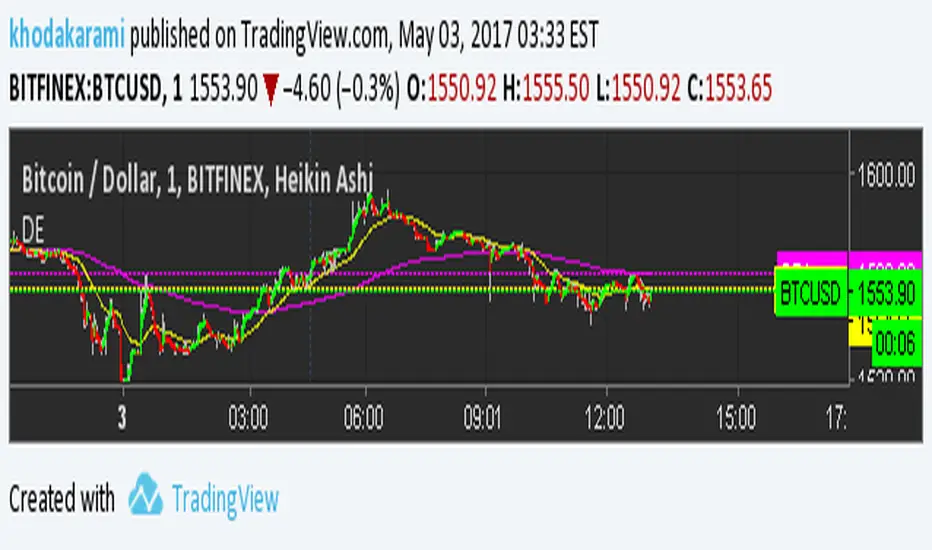
This indicator drops to EMA on your chart. by default it's using different number of bars to calculate the short and long range indicators per time frame. This system is wildly used by professionals to avoid false reading on market's trend and better make decisions. Remember, the crossing of these two indicators should not be used for getting a signal. Instead, you can look into long indicator to see the global market's trend and look at short indicator if the market is reversing the direction of trend to avoid false signals by other systems you may use.
There is also an input and when you check mark the check box, you can tweak the numbers and the two custom numbers will totally override the default ones to make it suite your needs.
There is also an input and when you check mark the check box, you can tweak the numbers and the two custom numbers will totally override the default ones to make it suite your needs.
開源腳本
本著TradingView的真正精神,此腳本的創建者將其開源,以便交易者可以查看和驗證其功能。向作者致敬!雖然您可以免費使用它,但請記住,重新發佈程式碼必須遵守我們的網站規則。
免責聲明
這些資訊和出版物並不意味著也不構成TradingView提供或認可的金融、投資、交易或其他類型的意見或建議。請在使用條款閱讀更多資訊。
開源腳本
本著TradingView的真正精神,此腳本的創建者將其開源,以便交易者可以查看和驗證其功能。向作者致敬!雖然您可以免費使用它,但請記住,重新發佈程式碼必須遵守我們的網站規則。
免責聲明
這些資訊和出版物並不意味著也不構成TradingView提供或認可的金融、投資、交易或其他類型的意見或建議。請在使用條款閱讀更多資訊。