OPEN-SOURCE SCRIPT
Bull/Bear Candle
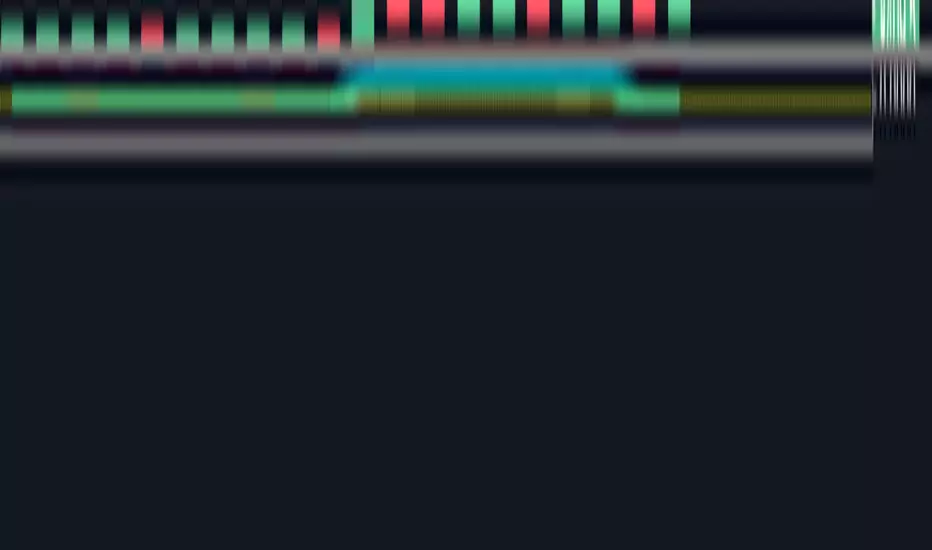
This script will display a small triangle under the latest two candles to indicate whether that candle is bullish or bearish based on the following definition.
A bullish candle closes in the top portion of the trading range of the candle while a bearish candle closes in the bottom portion of the trading range of the candle.
The cutoff is currently set at 65% (you can adjust it) so the close must be outside or equal to 65% of the trading range to be considered bullish or bearish. If less than 65% the triangle will indicate a neutral candle.
Colours are;
green triangle = bullish candle
red triangle = bearish candle
yellow triangle = neutral candle
I hope this helps those using TraderCobb's cradle strategy.
開源腳本
秉持TradingView一貫精神,這個腳本的創作者將其設為開源,以便交易者檢視並驗證其功能。向作者致敬!您可以免費使用此腳本,但請注意,重新發佈代碼需遵守我們的社群規範。
免責聲明
這些資訊和出版物並非旨在提供,也不構成TradingView提供或認可的任何形式的財務、投資、交易或其他類型的建議或推薦。請閱讀使用條款以了解更多資訊。
免責聲明
這些資訊和出版物並非旨在提供,也不構成TradingView提供或認可的任何形式的財務、投資、交易或其他類型的建議或推薦。請閱讀使用條款以了解更多資訊。