OPEN-SOURCE SCRIPT
Hull Kaufman SuperTrend Cloud (HKST Cloud)
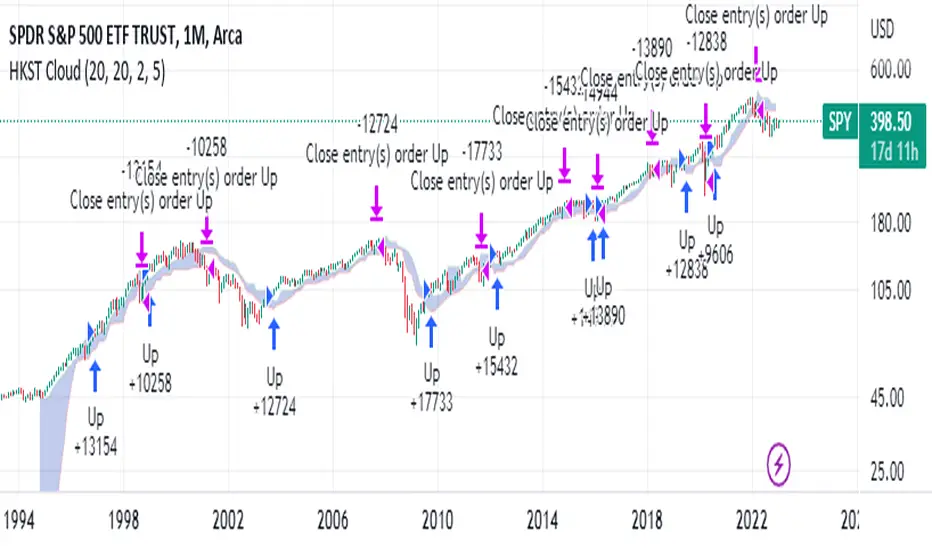
TLDR: This is a long only trend following system that uses highest and lowest values of three trend following indicators to form a "cloud". Enter when the candle high crosses above the highest band. Close if the low or close crosses below the lowest band.
3 indicators
1. Kaufman Adaptive moving Average - set at 20
2. Hull Moving Average (of the Kaufman Adaptive moving average) - set at 20
3. SuperTrend - I believe this is set at 5 periods and 3*atr but this can be changed
Cloud
the upper band is the highest of the 3 indicators
the lower band is the lowest of the 3 indicators
Entry and Exit:
Enter when the high crosses above the upper band of the cloud.
(This means you will only get a long signal if the high was previously below the upper band of the cloud and then crosses over.)
Exit when the low crosses below the lower band of the cloud .
(This means that this rule will only close if the low was previously above the upper band and then crosses under)
The "Exit" may not trigger if the low (the wick) never gets above the band. In this case the long order will close if the closing price is below the cloud.
Logic
Kaufamn is the best moving average i have found at responding to changes in volatility. This means it moves up or down quickly during expansive moves but becoming very flat during relative choppiness. However, getting flat causes the the Kaufman AMA to trigger a lot of false signals when volatility is transitioning from high to low. This is why the Hull moving average (with its rounded turns) keeps a lot of the false continuations contained because usually prices need to decisively move higher in order to over come the Hull moving average which continues to increase/decrease during the candles after an expansive move.
The super trend places a stagnant floor and ceiling which acts as a great stoploss or trigger as price action attempts to trend in a certain direction. The super trend allows for the user to adjust the likely hood of this cloud indicator changing from bullish to bearish based on the volatility of the asset that is being analyzed.
individually all of these are great. Together the trader can use this cloud to create a trend following or anlysis system that captures the bulk of moves.
Not my best explanation but this indicator is actually pretty simple.
Hope this helps. Happy Trades
-Snarky Puppy
開源腳本
本著TradingView的真正精神,此腳本的創建者將其開源,以便交易者可以查看和驗證其功能。向作者致敬!雖然您可以免費使用它,但請記住,重新發佈程式碼必須遵守我們的網站規則。
免責聲明
這些資訊和出版物並不意味著也不構成TradingView提供或認可的金融、投資、交易或其他類型的意見或建議。請在使用條款閱讀更多資訊。
開源腳本
本著TradingView的真正精神,此腳本的創建者將其開源,以便交易者可以查看和驗證其功能。向作者致敬!雖然您可以免費使用它,但請記住,重新發佈程式碼必須遵守我們的網站規則。
免責聲明
這些資訊和出版物並不意味著也不構成TradingView提供或認可的金融、投資、交易或其他類型的意見或建議。請在使用條款閱讀更多資訊。