OPEN-SOURCE SCRIPT
已更新 MACD At Scales with Alerts
I use the horizontal scale lines on the MACD indicator as part of my scalping strategy along with other indicators like RSI/EMA and Market Cipher B when trading BTC
I am looking for a cross above or below the 12.5 and 25 horizontal scale lines, along with lining up other indicators
I set my alerts on the 5 min TF and look to the 15 and 30 min TF's for further confirmation.
I have find the scale lines to be very useful for visual reference of the crosses, above/below 25 lines is mostly a safer trade, crosses above/below 12.5 lines can have more risk, crosses between 0 baseline and 12.5 can have a higher return but have much more risk.
Don't ever use just this indicator by itself, you must always have at least 2 indicators running
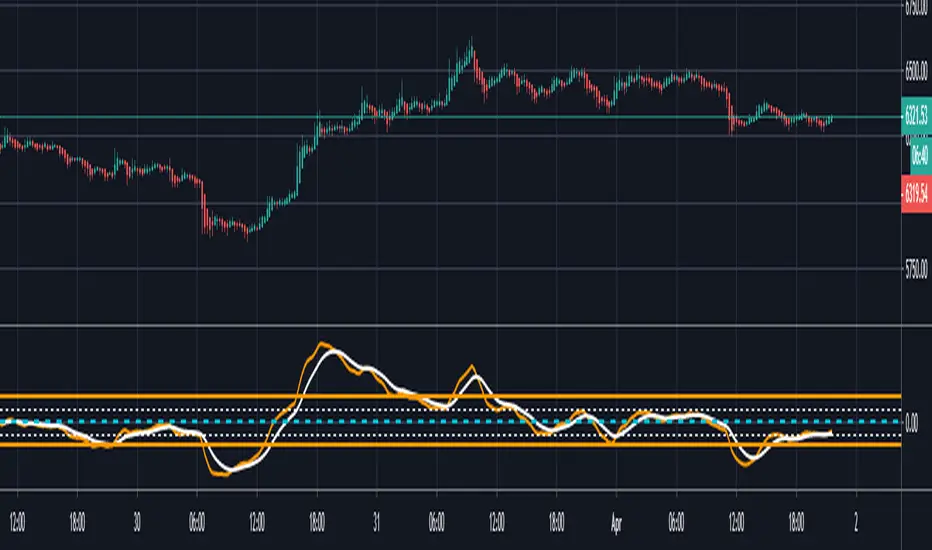
This is an example of the TF's not lining up, so a entry here would be high risk
https://www.tradingview.com/x/zg2Kwp4M/
This is an example of the TF's lining up, so a entry here would be less risk
https://www.tradingview.com/x/GyUr3Y2B/
I am looking for a cross above or below the 12.5 and 25 horizontal scale lines, along with lining up other indicators
I set my alerts on the 5 min TF and look to the 15 and 30 min TF's for further confirmation.
I have find the scale lines to be very useful for visual reference of the crosses, above/below 25 lines is mostly a safer trade, crosses above/below 12.5 lines can have more risk, crosses between 0 baseline and 12.5 can have a higher return but have much more risk.
Don't ever use just this indicator by itself, you must always have at least 2 indicators running
This is an example of the TF's not lining up, so a entry here would be high risk
https://www.tradingview.com/x/zg2Kwp4M/
This is an example of the TF's lining up, so a entry here would be less risk
https://www.tradingview.com/x/GyUr3Y2B/
發行說明
This is an example of 5m, 15m and 30m TF's not lining up, so a entry here would be high riskThis is an example of 5m, 15m and 30m TF's lining up, so a entry here would be lower risk, please observe the times under the white vertical lines i would be entering using the 15m
And never forget, if you use this indicator alone to make entry, its always higher risk
發行說明
Update: fixed code alerts so at 25 and -25 levels it doesn't give you double alerts for both 12.5 and 25開源腳本
秉持TradingView一貫精神,這個腳本的創作者將其設為開源,以便交易者檢視並驗證其功能。向作者致敬!您可以免費使用此腳本,但請注意,重新發佈代碼需遵守我們的社群規範。
免責聲明
這些資訊和出版物並非旨在提供,也不構成TradingView提供或認可的任何形式的財務、投資、交易或其他類型的建議或推薦。請閱讀使用條款以了解更多資訊。
免責聲明
這些資訊和出版物並非旨在提供,也不構成TradingView提供或認可的任何形式的財務、投資、交易或其他類型的建議或推薦。請閱讀使用條款以了解更多資訊。