INVITE-ONLY SCRIPT
Trendfinder
Our Indicator “Trendfinder” offers an insight into the underlying Trend of any given Instrument applied to. Understanding Trends is essential for using this Indicator. If you are familiar with the concept, then you will most likely find this indicator useful in your trading. If you are unfamiliar with the concept and are interested then continue reading a “Brief Concept of Trend Trading” at the end of the description, where we will provide some informational Links.
This description will provide a High Level description of how our Indicator identifies and visualizes Trends, followed by how to use the Indicator in your trading. At the end we would like to introduce our team and experience.
High Level Description of “Trendfinder”:
Our indicator analyzes a short term and long term trend. The Trend is determined off of volatility and MA analysis.
Combining both these concepts helps in Identifying the Trend and avoiding Ranges.
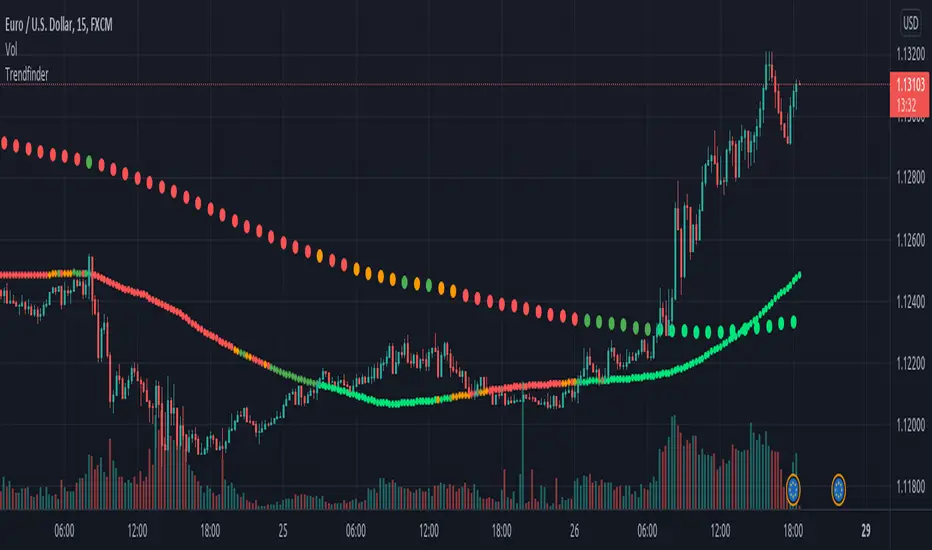
Visualisation:
The Trendfinder displays 2 dotted Lines. The Bigger dots is a long Term Trend Analysis which will be referred to as Longterm-Line from now on. The Smaller dots is the short term Trend which will be referred to as Shortterm-Line from now on.
Each Line can display 5 different colors symbolizing the Trend strength.
Gray → no trend
Green → weak bull trend
Lime → strong bull trend
Orange → weak bear trend
Red → strong bear trend
How to use it:
Our indicator is best used with Trend trading Strategies.
It is important to use Entry- and Exit strategies familiar with you, and not to use this Indicator as a Blind signal.
Its best to sync the Longterm-line with the Shortterm-line, to be trading in the same direction as the Long term Trend.
That being said, its advised to wait for the Longterm-line and Shortterm-line to be both either Bullish or both bearish.
Time frame:
This indicator is programmed to be used on all Timeframes.
Instruments:
This indicator aims to visualize areas of where Market price has the potential to trend, hence this is a trend trading Indicator.
Taking this statement to account, it is recommended to apply this Indicator to Instruments with a trending character.
Indicator settings and configuration:
The Indicator has no functional parameters, to reduce User error, and only has visual parameters. The color of the Supply and Demand Zones can be tailored to your liking.
Brief concept of Trend Trading:
Trend Trading is a concept that has been around for a very long time. Following links are helpful to get a grasp of the concept:
https://www.investopedia.com/terms/t/trendtrading.asp
Our Team:
We are a team of 3 Traders with a combined experience of 40 years. We are using our experiences from the market to create Indicators to Visualize the most relevant Patterns to us in our trading today. Our goal is to reconstruct these patterns to match our understanding of the market and to simplify the process of creating reproducible trading Strategies.
This description will provide a High Level description of how our Indicator identifies and visualizes Trends, followed by how to use the Indicator in your trading. At the end we would like to introduce our team and experience.
High Level Description of “Trendfinder”:
Our indicator analyzes a short term and long term trend. The Trend is determined off of volatility and MA analysis.
Combining both these concepts helps in Identifying the Trend and avoiding Ranges.
Visualisation:
The Trendfinder displays 2 dotted Lines. The Bigger dots is a long Term Trend Analysis which will be referred to as Longterm-Line from now on. The Smaller dots is the short term Trend which will be referred to as Shortterm-Line from now on.
Each Line can display 5 different colors symbolizing the Trend strength.
Gray → no trend
Green → weak bull trend
Lime → strong bull trend
Orange → weak bear trend
Red → strong bear trend
How to use it:
Our indicator is best used with Trend trading Strategies.
It is important to use Entry- and Exit strategies familiar with you, and not to use this Indicator as a Blind signal.
Its best to sync the Longterm-line with the Shortterm-line, to be trading in the same direction as the Long term Trend.
That being said, its advised to wait for the Longterm-line and Shortterm-line to be both either Bullish or both bearish.
Time frame:
This indicator is programmed to be used on all Timeframes.
Instruments:
This indicator aims to visualize areas of where Market price has the potential to trend, hence this is a trend trading Indicator.
Taking this statement to account, it is recommended to apply this Indicator to Instruments with a trending character.
Indicator settings and configuration:
The Indicator has no functional parameters, to reduce User error, and only has visual parameters. The color of the Supply and Demand Zones can be tailored to your liking.
Brief concept of Trend Trading:
Trend Trading is a concept that has been around for a very long time. Following links are helpful to get a grasp of the concept:
https://www.investopedia.com/terms/t/trendtrading.asp
Our Team:
We are a team of 3 Traders with a combined experience of 40 years. We are using our experiences from the market to create Indicators to Visualize the most relevant Patterns to us in our trading today. Our goal is to reconstruct these patterns to match our understanding of the market and to simplify the process of creating reproducible trading Strategies.
僅限邀請腳本
只有經作者批准的使用者才能訪問此腳本。您需要申請並獲得使用權限。該權限通常在付款後授予。如欲了解更多詳情,請依照以下作者的說明操作,或直接聯絡account_closed。
除非您完全信任其作者並了解腳本的工作原理,否則TradingView不建議您付費或使用腳本。您也可以在我們的社群腳本中找到免費的開源替代方案。
作者的說明
DM for further instructions
免責聲明
這些資訊和出版物並不意味著也不構成TradingView提供或認可的金融、投資、交易或其他類型的意見或建議。請在使用條款閱讀更多資訊。
僅限邀請腳本
只有經作者批准的使用者才能訪問此腳本。您需要申請並獲得使用權限。該權限通常在付款後授予。如欲了解更多詳情,請依照以下作者的說明操作,或直接聯絡account_closed。
除非您完全信任其作者並了解腳本的工作原理,否則TradingView不建議您付費或使用腳本。您也可以在我們的社群腳本中找到免費的開源替代方案。
作者的說明
DM for further instructions
免責聲明
這些資訊和出版物並不意味著也不構成TradingView提供或認可的金融、投資、交易或其他類型的意見或建議。請在使用條款閱讀更多資訊。