PROTECTED SOURCE SCRIPT
已更新 THE WICKLESS CANDLE By [VXN]
The Wickless Candles Strategy - Comprehensive Analysis
Core Concept
The "Wickless Candles" strategy is a technical analysis approach that identifies specific candlestick formations where one side of the candle has no wick, indicating strong directional momentum and potential support/resistance levels.
What Are Wickless Candles?
Bullish Wickless Candles
Meaning: A green candle where the opening price equals the lowest price
Significance: Shows that buyers immediately took control and never let price fall below the opening level
Implication: The opening price becomes a strong support level
Bearish Wickless Candles
Meaning: A red candle where the opening price equals the highest price
Significance: Shows that sellers immediately dominated and never let price rise above the opening level
Implication: The opening price becomes a strong resistance level
Visual Strategy Elements
Support/Resistance Lines
Bullish Lines: Green horizontal lines drawn at the low (open) price of wickless bullish candles
Bearish Lines: Red horizontal lines drawn at the high (open) price of wickless bearish candles
Extension: Lines project forward for 5 bars (configurable) to highlight key levels
Purpose: These levels often act as future support/resistance zones
Advanced Volume Analysis (4:00 AM - 9:29 AM Session)
Volume Calculations
Market Dominance Indicators
🟢🟢🟢🔴: Buyer dominance (more buying pressure)
🔴🔴🔴🟢: Seller dominance (more selling pressure)
🟢🟢🔴🔴: Balanced market (equal pressure)
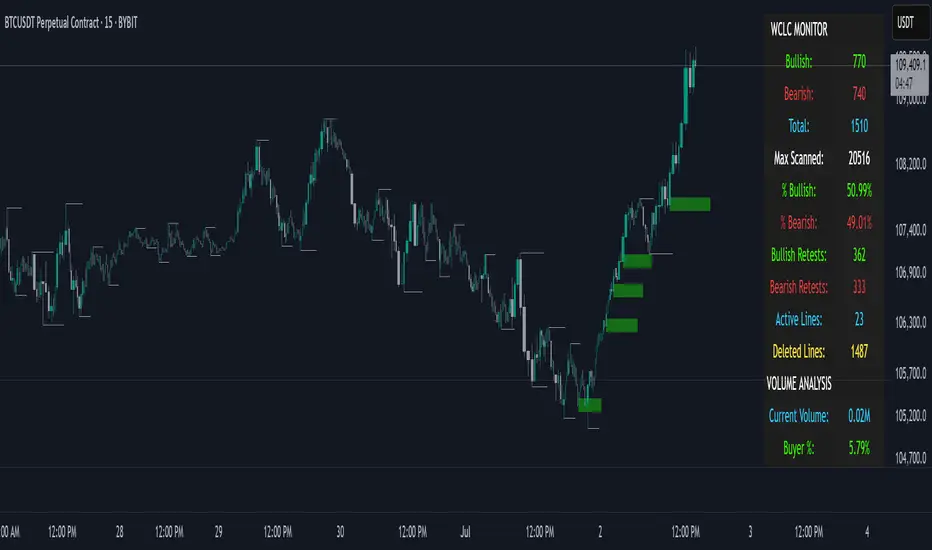
Comprehensive Statistics Monitor
Wickless Candle Metrics
Bullish Count: Total number of bullish wickless candles detected
Bearish Count: Total number of bearish wickless candles detected
Total Wickless: Combined count of all wickless formations
Max Scanned: Total number of candles analyzed
Percentages: Bullish vs bearish distribution ratios
Volume Intelligence
Current Volume: Real-time session volume in millions
Buyer/Seller Percentages: Relative strength of each side
Market Dominance: Visual representation of controlling force
Strategic Applications
Entry Signals
Long Entries: Near bullish wickless candle support lines
Short Entries: Near bearish wickless candle resistance lines
Confirmation: Use volume dominance to confirm directional bias
Market Context
Institutional Interest: Wickless candles often indicate large player activity
Price Rejection: Shows where market participants strongly defended levels
Momentum Confirmation: Volume analysis validates the strength behind moves
Key Advantages
Objective Identification: Clear mathematical criteria for wickless formations
Real-Time Monitoring: Live statistics and volume analysis
Multi-Timeframe Application: Works across different chart intervals
Alert System: Automatic notifications when new levels are established
Visual Clarity: Easy-to-spot support/resistance lines on chart
This strategy combines traditional candlestick analysis with modern volume profiling to identify high-probability trading zones where institutional and retail sentiment align at specific price levels.
Core Concept
The "Wickless Candles" strategy is a technical analysis approach that identifies specific candlestick formations where one side of the candle has no wick, indicating strong directional momentum and potential support/resistance levels.
What Are Wickless Candles?
Bullish Wickless Candles
Meaning: A green candle where the opening price equals the lowest price
Significance: Shows that buyers immediately took control and never let price fall below the opening level
Implication: The opening price becomes a strong support level
Bearish Wickless Candles
Meaning: A red candle where the opening price equals the highest price
Significance: Shows that sellers immediately dominated and never let price rise above the opening level
Implication: The opening price becomes a strong resistance level
Visual Strategy Elements
Support/Resistance Lines
Bullish Lines: Green horizontal lines drawn at the low (open) price of wickless bullish candles
Bearish Lines: Red horizontal lines drawn at the high (open) price of wickless bearish candles
Extension: Lines project forward for 5 bars (configurable) to highlight key levels
Purpose: These levels often act as future support/resistance zones
Advanced Volume Analysis (4:00 AM - 9:29 AM Session)
Volume Calculations
Market Dominance Indicators
🟢🟢🟢🔴: Buyer dominance (more buying pressure)
🔴🔴🔴🟢: Seller dominance (more selling pressure)
🟢🟢🔴🔴: Balanced market (equal pressure)
Comprehensive Statistics Monitor
Wickless Candle Metrics
Bullish Count: Total number of bullish wickless candles detected
Bearish Count: Total number of bearish wickless candles detected
Total Wickless: Combined count of all wickless formations
Max Scanned: Total number of candles analyzed
Percentages: Bullish vs bearish distribution ratios
Volume Intelligence
Current Volume: Real-time session volume in millions
Buyer/Seller Percentages: Relative strength of each side
Market Dominance: Visual representation of controlling force
Strategic Applications
Entry Signals
Long Entries: Near bullish wickless candle support lines
Short Entries: Near bearish wickless candle resistance lines
Confirmation: Use volume dominance to confirm directional bias
Market Context
Institutional Interest: Wickless candles often indicate large player activity
Price Rejection: Shows where market participants strongly defended levels
Momentum Confirmation: Volume analysis validates the strength behind moves
Key Advantages
Objective Identification: Clear mathematical criteria for wickless formations
Real-Time Monitoring: Live statistics and volume analysis
Multi-Timeframe Application: Works across different chart intervals
Alert System: Automatic notifications when new levels are established
Visual Clarity: Easy-to-spot support/resistance lines on chart
This strategy combines traditional candlestick analysis with modern volume profiling to identify high-probability trading zones where institutional and retail sentiment align at specific price levels.
發行說明
Major Update Summary & New Features Added1. Smart Line Management
Auto-Delete Used Lines: Configurable setting to automatically remove lines once price crosses through them
Line Lifecycle Tracking: Complete monitoring of line creation, usage, and deletion
Memory Optimization: Prevents chart clutter by intelligently managing active lines
2. Advanced Retest Detection
Bullish Retest Alerts: Triggered when price dips below support line but closes above (one-time per line)
Bearish Retest Alerts: Triggered when price spikes above resistance line but closes below (one-time per line)
Smart Alert Logic: Prevents duplicate notifications with built-in retest tracking
3. Professional Dark Theme
Modern Color Palette: Carefully selected dark theme colors for enhanced visibility
Improved Contrast: Better readability with optimized text/background combinations
Consistent Styling: Unified design language throughout the entire interface
4. Customizable Table Interface
Resizable Dimensions: User-adjustable width (150-400px) and height (200-600px)
Dynamic Font Scaling: Automatic font size adjustment based on table dimensions
Enhanced Statistics: Added retest counters and line management metrics
📊 Enhanced Statistics Monitor
New Metrics Added:
Active Lines Count
Deleted Lines Count
Bullish Retest Count
Bearish Retest Count
Improved Organization:
Sectioned layout (Wickless Stats, Line Management, Volume Analysis, Table Info)
Color-coded categories for quick visual scanning
Professional data presentation
🔔 Alert System Expansion
4 Total Alert Types One Click:
Bullish Wickless Detection (Original)
Bearish Wickless Detection (Original)
Bullish Retest Detection (NEW)
Bearish Retest Detection (NEW)
Alert Features:
Detailed information including ticker, price, and timeframe
One-time retest alerts prevent spam
Immediate notification upon condition detection
⚡ Technical Improvements
Performance Optimizations:
Efficient array management for line tracking
Memory-conscious deletion processes
Scalable architecture for high-frequency trading
Code Quality:
Modular function design
Comprehensive error handling
Clean variable management
🎯 User Benefits
Cleaner Charts: Auto-deletion keeps charts uncluttered
Better Trade Timing: Retest alerts identify key reversal points
Enhanced Visibility: Dark theme reduces eye strain
Customizable Interface: Adjustable table size for any screen
Complete Analytics: Comprehensive statistics for strategy analysis
This update transforms the Wickless Candle indicator from a basic pattern detector into a comprehensive trading tool with intelligent line management, advanced alerting, and professional presentation.
發行說明
Added Stop Loss Level Identification System - Pivot High/Low detection
Clearer Chart
- Auto Delete Used Lines
受保護腳本
此腳本以閉源形式發佈。 不過,您可以自由使用,沒有任何限制 — 點擊此處了解更多。
免責聲明
這些資訊和出版物並非旨在提供,也不構成TradingView提供或認可的任何形式的財務、投資、交易或其他類型的建議或推薦。請閱讀使用條款以了解更多資訊。
免責聲明
這些資訊和出版物並非旨在提供,也不構成TradingView提供或認可的任何形式的財務、投資、交易或其他類型的建議或推薦。請閱讀使用條款以了解更多資訊。