OPEN-SOURCE SCRIPT
已更新 Parabolic sar with breaks
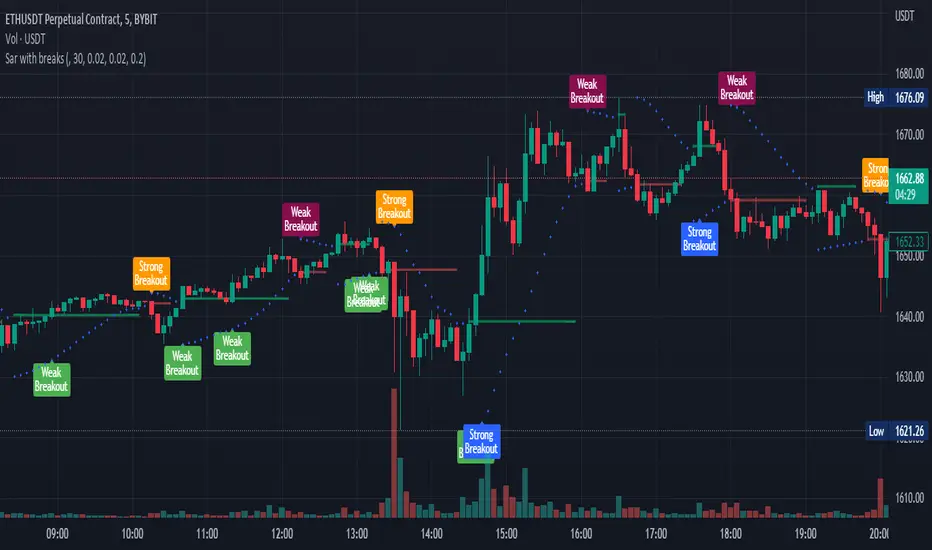
This plots a Parabolic sar and a break line on the previous sar point before the parabolic sar flips.
This is looking to be a very popular entry signal for lots of strats.
How to use:
In conjunction with other confirmation indicators;
Long: Enter long when the Parabolic sar is below the price and the price breaks above (and closes) the break line.
Short: Enter short when the Parabolic sar is above the price and the price breaks below (and closes) the break line.
A great indicator combination for this is to use a 200 ema for price trend and volume flow.
發行說明
Added long and short labels that show when the psar line is broken with high volume發行說明
Changed chartAdded check that labels should not show if the breaking candle has a long wick
發行說明
removed wick check as it was buggy發行說明
Only show signals when parabolic sar is bullish/bearish.發行說明
Selectable timeframe發行說明
Added alerts and changed breakout labels.After some research, I have found that when a parabolic Sar Breakout line is broken by price with high volume, it is much more likely to continue in that direction, and so I have have added strong and weak breakout labels.
You are able to show/hide them individually.
開源腳本
本著TradingView的真正精神,此腳本的創建者將其開源,以便交易者可以查看和驗證其功能。向作者致敬!雖然您可以免費使用它,但請記住,重新發佈程式碼必須遵守我們的網站規則。
免責聲明
這些資訊和出版物並不意味著也不構成TradingView提供或認可的金融、投資、交易或其他類型的意見或建議。請在使用條款閱讀更多資訊。
開源腳本
本著TradingView的真正精神,此腳本的創建者將其開源,以便交易者可以查看和驗證其功能。向作者致敬!雖然您可以免費使用它,但請記住,重新發佈程式碼必須遵守我們的網站規則。
免責聲明
這些資訊和出版物並不意味著也不構成TradingView提供或認可的金融、投資、交易或其他類型的意見或建議。請在使用條款閱讀更多資訊。