INVITE-ONLY SCRIPT
Trader Jumblo Auto Signal V6
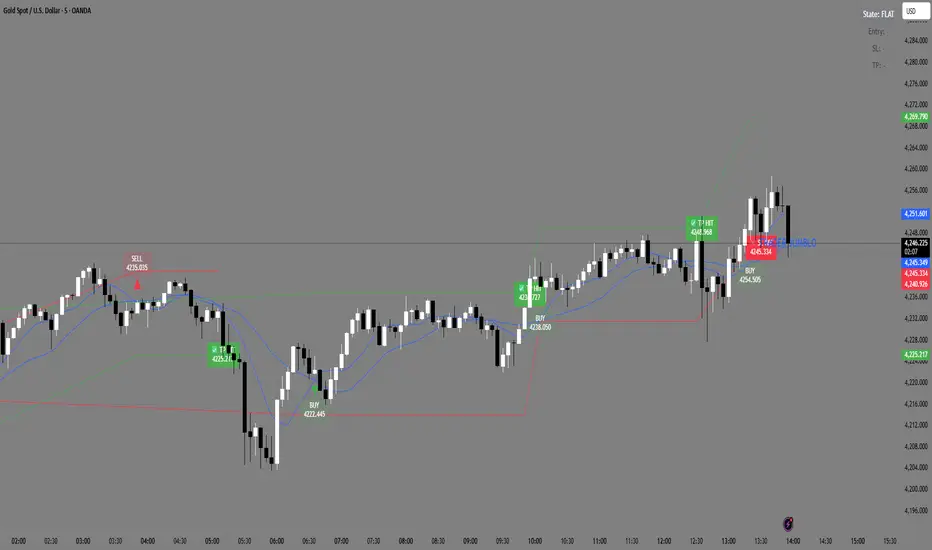
Trader Jumblo Auto Signal V6 is an advanced crossover-based signal system designed to generate persistent BUY and SELL entries with dynamic ATR-based Take Profit (TP) and Stop Loss (SL) levels.It provides clean, non-repainting trade signals that remain visible on the chart even after price movement — ensuring clarity during both backtesting and live trading sessions.
⚙️ How It Works
🟦 Two Blue Lines — These are your moving averages (Fast and Slow).
The crossover between them determines the signal direction.
When the Fast MA (light blue) crosses above the Slow MA → a BUY signal appears.
When the Fast MA crosses below the Slow MA → a SELL signal appears.
You can choose between SMA or EMA and adjust the lengths in the settings.
🟢 Green Line — The Take Profit (TP) level, calculated using ATR × TP multiplier.
It shows the projected target area for profit when a trade is active.
🔴 Red Line — The Stop Loss (SL) level, also based on ATR × SL multiplier.
It marks the risk boundary for each signal.
✅ When price reaches the green line, “TP HIT” appears.
❌ When price hits the red line, “SL HIT” appears.
These markers persist so you can analyze trade outcomes clearly.
📈 Main Features
Dynamic ATR-based TP and SL levels (auto-adjust with volatility)
Persistent entry, TP, and SL labels (no vanishing signals)
Optional RSI filter for signal confirmation
Instant alert system for BUY/SELL/TP/SL or combined events
Lightweight and optimized for any timeframe
⚡ Best Use
Ideal for swing and intraday traders who want visual clarity and structured risk/reward zones. Works effectively on Gold, Forex, crypto, indices, and stocks
僅限邀請腳本
僅作者批准的使用者才能訪問此腳本。您需要申請並獲得使用許可,通常需在付款後才能取得。更多詳情,請依照作者以下的指示操作,或直接聯絡TraderJumblo。
TradingView不建議在未完全信任作者並了解其運作方式的情況下購買或使用腳本。您也可以在我們的社群腳本中找到免費的開源替代方案。
作者的說明
✅ Author’s Instructions (short version)
Add to chart → choose SMA or EMA → optional RSI filter.
BUY/SELL signals show with ATR-based TP (green) & SL (red).
Labels appear exactly where TP/SL is hit.
Watermark follows live price.
Use alerts for BUY/
免責聲明
這些資訊和出版物並非旨在提供,也不構成TradingView提供或認可的任何形式的財務、投資、交易或其他類型的建議或推薦。請閱讀使用條款以了解更多資訊。