PROTECTED SOURCE SCRIPT
已更新 [blackcat] L3 RS MSFIELD Crypto
Level: 3
Background
When a wave of market conditions in the cryptocurrency market comes, how do you choose which cryptocurrency target to operate?
Function
The function of this indicator is to compare the strength of a single target with the strength of the crypto market. For any cryptocurrency, if its strength is lower than the rise of the cryptocurrency index, then this target is a manifestation of weakness, and you can short it at this time. On the contrary, if a single target rises higher than the cryptocurrency index, then it may be the leader of this wave of market. Therefore, in a bull market, those indicators that are stronger than the crypto market should be our long-term targets; in a bear market, Those indicators that are weaker than the crypto market are all short-selling targets that we should pay attention to.
Its specific use method is as follows:
1. If the market is in the recovery period at the end of the bear market, the indicator can approach 0 from below 0. Its direction is continuously upward, which means that the target is in a rebound market and can be long. If the rising market continues and can maintain a strong market for a long time, the indicator must be in a strong area above the 0 axis. In the same way, the bear market adopts a strategy below the 0 axis.
2. If you want to achieve a stable transaction, the buying point for long positions must be above the 0 axis, and the selling point for short positions must be below the 0 axis.
3. If the retracement falls below the zero axis in the bull market, it means that it is not a market relay, but a market reversal.
4. This indicator does not provide specific buying and selling points, but can only provide a reference relative to the crypto market. The specific buying and selling points and trends still need to be realized in conjunction with other technical indicators.
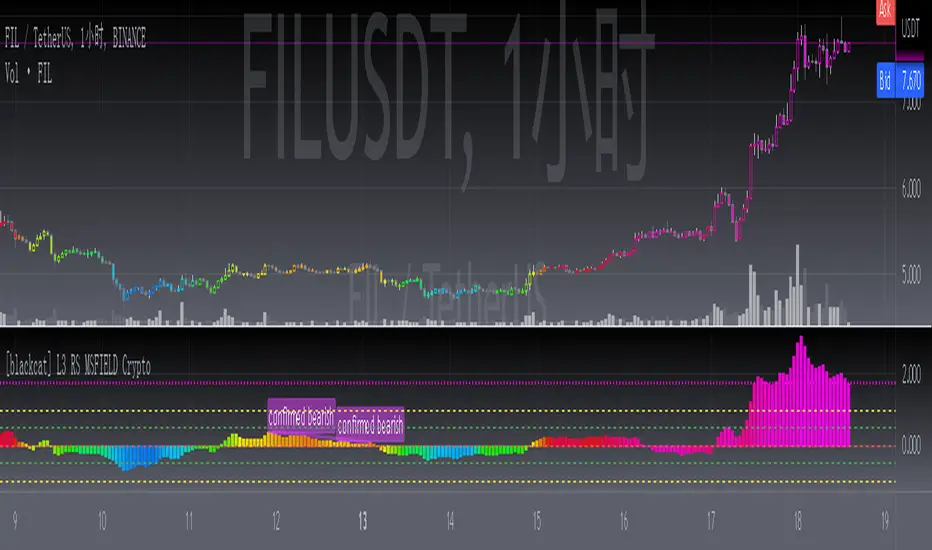
I distinguish the trend strength by color, which can be interpreted corresponding to RSI 0-100:
1. Deep Bear 0-20, blue
2. Bearish 20-40, green
3. Shock market 40-60, yellow
5. Bullish 60-80, red
6. Deep Bull Market 80-100, Fuchsia
Remarks
This indicator DOES NOT provide long/short entry points. You need combine other indicators to trade.
Feedbacks are appreciated.
Background
When a wave of market conditions in the cryptocurrency market comes, how do you choose which cryptocurrency target to operate?
Function
The function of this indicator is to compare the strength of a single target with the strength of the crypto market. For any cryptocurrency, if its strength is lower than the rise of the cryptocurrency index, then this target is a manifestation of weakness, and you can short it at this time. On the contrary, if a single target rises higher than the cryptocurrency index, then it may be the leader of this wave of market. Therefore, in a bull market, those indicators that are stronger than the crypto market should be our long-term targets; in a bear market, Those indicators that are weaker than the crypto market are all short-selling targets that we should pay attention to.
Its specific use method is as follows:
1. If the market is in the recovery period at the end of the bear market, the indicator can approach 0 from below 0. Its direction is continuously upward, which means that the target is in a rebound market and can be long. If the rising market continues and can maintain a strong market for a long time, the indicator must be in a strong area above the 0 axis. In the same way, the bear market adopts a strategy below the 0 axis.
2. If you want to achieve a stable transaction, the buying point for long positions must be above the 0 axis, and the selling point for short positions must be below the 0 axis.
3. If the retracement falls below the zero axis in the bull market, it means that it is not a market relay, but a market reversal.
4. This indicator does not provide specific buying and selling points, but can only provide a reference relative to the crypto market. The specific buying and selling points and trends still need to be realized in conjunction with other technical indicators.
I distinguish the trend strength by color, which can be interpreted corresponding to RSI 0-100:
1. Deep Bear 0-20, blue
2. Bearish 20-40, green
3. Shock market 40-60, yellow
5. Bullish 60-80, red
6. Deep Bull Market 80-100, Fuchsia
Remarks
This indicator DOES NOT provide long/short entry points. You need combine other indicators to trade.
Feedbacks are appreciated.
發行說明
delete someting useless受保護腳本
此腳本以閉源形式發佈。 不過,您可以自由使用,沒有任何限制 — 點擊此處了解更多。
Avoid losing contact!Don't miss out! The first and most important thing to do is to join my Discord chat now! Click here to start your adventure: discord.com/invite/ZTGpQJq 防止失联,请立即行动,加入本猫聊天群: discord.com/invite/ZTGpQJq
免責聲明
這些資訊和出版物並非旨在提供,也不構成TradingView提供或認可的任何形式的財務、投資、交易或其他類型的建議或推薦。請閱讀使用條款以了解更多資訊。
受保護腳本
此腳本以閉源形式發佈。 不過,您可以自由使用,沒有任何限制 — 點擊此處了解更多。
Avoid losing contact!Don't miss out! The first and most important thing to do is to join my Discord chat now! Click here to start your adventure: discord.com/invite/ZTGpQJq 防止失联,请立即行动,加入本猫聊天群: discord.com/invite/ZTGpQJq
免責聲明
這些資訊和出版物並非旨在提供,也不構成TradingView提供或認可的任何形式的財務、投資、交易或其他類型的建議或推薦。請閱讀使用條款以了解更多資訊。