INVITE-ONLY SCRIPT
CFT Auto Support & Resistance Levels

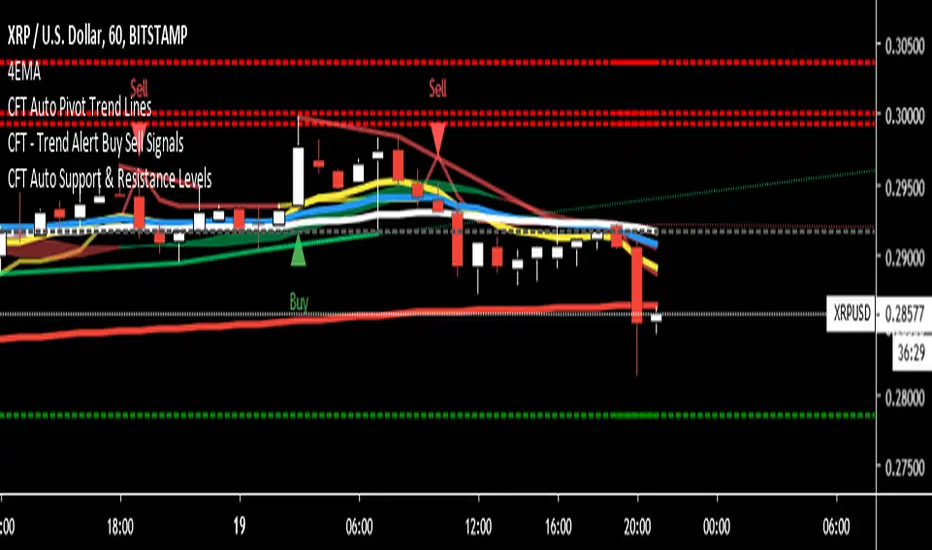
CFT Auto Support & Resistance Indicator automatically draws support & resistance lines on your chart based on looking back at previous price levels.
These levels should be used as entry and exit areas. Wait for price to hit support and resistance areas and bounce to confirm. Then you can enter near support and sell near resistance with low risk. Remember Price needs to Bounce for counter trend or reversal play and price needs to break above or below and hold above or below for break out or continuation play.
This indicator works well in combination with our CFT Trend Buy & Sell Alerts and CFT Volume Flow
If you need help just message me.
Thank you,
CFT
免責聲明
這些資訊和出版物並非旨在提供,也不構成TradingView提供或認可的任何形式的財務、投資、交易或其他類型的建議或推薦。請閱讀使用條款以了解更多資訊。