PROTECTED SOURCE SCRIPT
candle stats v1
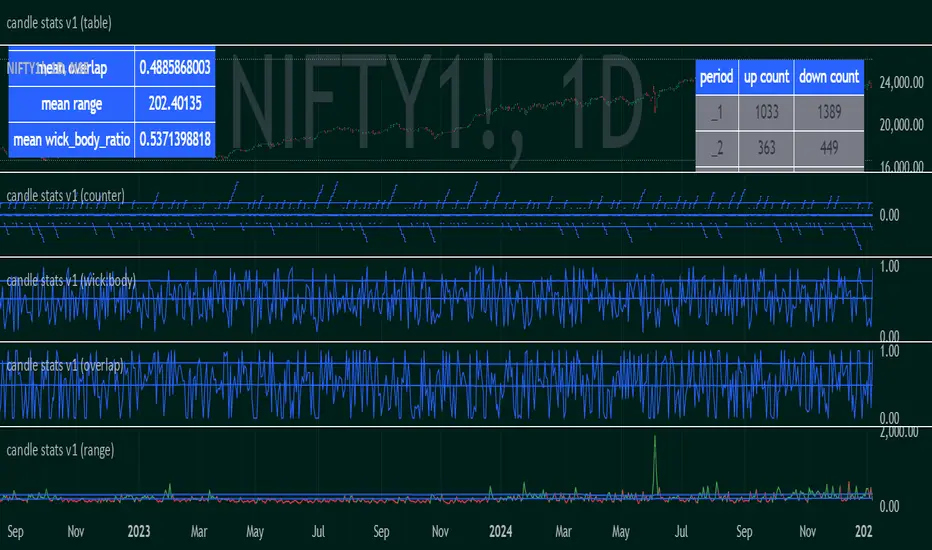
Objective:
Capture sequential/subsequent candle's relative properties
Average observations to represent the landscape of the marketplace
Parameters:
"range" : high-low
"overlap" : range - range[1]
"wick_body_ratio" : (range - abs(open-close))/range
"up_count" for "period" : number of occurrences where <period> consecutive candles have low>low[i+1]. (note: the values are not cumulative over period)
*"down_count" for "period" : number of occurrences where <period> consecutive candles have high<high[i+1]. (note: the values are not cumulative over period)
** the last counter includes the value for "period" and all above
Basic inferences:
mean_range could be used to derive at an appropriate hard-stoploss
high wick to body ratio indicates healthy buzzing market, ie, each candle has a high frequency standing wave within it. a lower value indicates that the timeframe is ordered and highly directional
low overlap indicates trend definition/resolution
the counters show how likely or unlikely a run up or run down of a particular length is
a combination of counter and mean_range could be used to derive at an appropriate take profit
Use case:
to determine the appropriate timeframe to develop or apply a strategy
Future enhancements:
more complex relationships such as higher highs and lower lows
frequency of oscillations
受保護腳本
此腳本以閉源形式發佈。 不過,您可以自由且不受任何限制地使用它 — 在此處了解更多資訊。
免責聲明
這些資訊和出版物並不意味著也不構成TradingView提供或認可的金融、投資、交易或其他類型的意見或建議。請在使用條款閱讀更多資訊。
受保護腳本
此腳本以閉源形式發佈。 不過,您可以自由且不受任何限制地使用它 — 在此處了解更多資訊。
免責聲明
這些資訊和出版物並不意味著也不構成TradingView提供或認可的金融、投資、交易或其他類型的意見或建議。請在使用條款閱讀更多資訊。