OPEN-SOURCE SCRIPT
Composite RSI [KFB Quant]
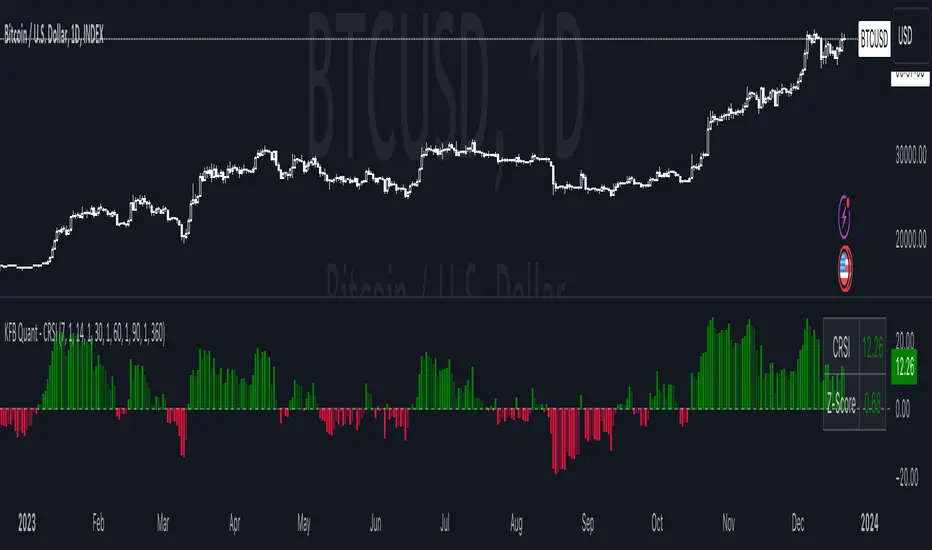
The Composite RSI (CRSI) is a momentum oscillator that combines 5 adjustable RSI's. It also has a Z-Score to make it easier to identify potential market extremes.
How to adjust the indicator
How to adjust the indicator
- Inside the Length & Impact Configuration tab you can adjust the length and impact of each RSI as well as the Z-Score length specific to your needs. The default length inputs are 7, 14, 30, 60, 90 (RSI 1 - RSI 5) and the default impact is set to 1.0 for all RSI's. Default length for Z-Score is 360.
- Inside the Style Configuration tab you can pick what you want to display(plot). The options are: CRSI, Z-Score, Overview Table and the individual RSI's.
- Inside the Color Configuration tab you can customize the color of each plot.
How the script worksCRSI = rsi_sum / imp_sumZ-Score = (crsi - crsi_mean) / crsi_stdev - rsi_sum = (rsi_1 -50) + (rsi_2 -50) + (rsi_3 -50) + (rsi_4 -50) + (rsi_5 -50)
- imp_sum = imp_1 + imp_2 + imp_3 + imp_4 + imp_5
- crsi_mean = Average of the crsi over the defined period in Z-Score Length
- crsi_stdev = StDev of crsi over the defined period in Z-Score Length
This is not financial advice. Trading is risky & most traders lose money. Past performance does not guarantee future results. This indicator is for informational & educational purposes only.
開源腳本
秉持TradingView一貫精神,這個腳本的創作者將其設為開源,以便交易者檢視並驗證其功能。向作者致敬!您可以免費使用此腳本,但請注意,重新發佈代碼需遵守我們的社群規範。
免責聲明
這些資訊和出版物並非旨在提供,也不構成TradingView提供或認可的任何形式的財務、投資、交易或其他類型的建議或推薦。請閱讀使用條款以了解更多資訊。
免責聲明
這些資訊和出版物並非旨在提供,也不構成TradingView提供或認可的任何形式的財務、投資、交易或其他類型的建議或推薦。請閱讀使用條款以了解更多資訊。