OPEN-SOURCE SCRIPT
已更新 Zigzag Trend-based Color [SteinG]
Zigzag Indicator with Trend-based Color Coding and Info Table
This indicator is forked from Trendoscope's Recursive Zigzag
The Zigzag Indicator with Trend-based Color Coding and Info Table is a powerful tool for technical analysis, designed to help you identify significant price swings, visualize trends, and analyze pivot points with ease. This advanced indicator offers enhanced functionalities and improved visual representation.
The primary purpose of the Zigzag Indicator is to identify and highlight important price reversals, commonly referred to as pivot points, in a given chart. These pivot points are essential in recognizing trend changes and potential market turning points. With the Zigzag Indicator, you can quickly identify these pivotal moments and gain valuable insights into market dynamics.
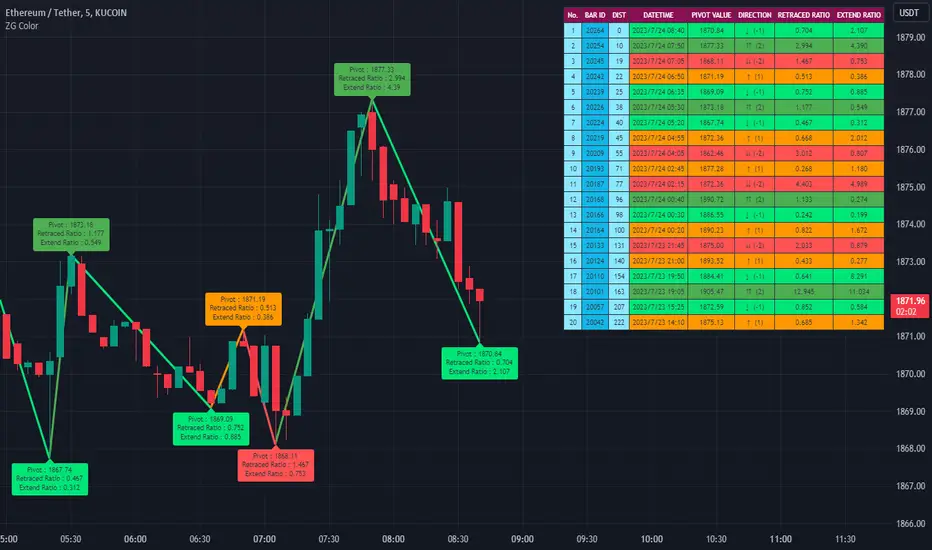
One of the standout features of this indicator is the color coding applied to the Zigzag line, which intuitively reflects the trend associated with each pivot point. The color scheme is as follows:
- Green: Indicates an upward trend, representing a bullish movement in the price.
- Lime: Represents a retracement during an upward trend, indicating a temporary pullback before the uptrend resumes.
- Red: Signifies a downward trend, indicating a bearish movement in the price.
- Orange: Represents a retracement during a downward trend, indicating a temporary bounce before the downtrend resumes.
This color coding allows you to easily visualize the prevailing market sentiment and make more informed trading decisions accordingly.
In addition to the visual representation, the Zigzag Indicator also includes an informative table that provides essential details about each pivot point. The table presents the following information for each pivot point:
1. Pivot Value: The price level at which the pivot point occurs.
2. Direction: Indicates whether the pivot point represents an upward or downward trend.
3. Fibo Ratios: Displays the Fibonacci retracement levels between two consecutive pivot points, offering insights into potential support and resistance levels.
The inclusion of this comprehensive info table enables you to analyze pivot points more effectively, understand the underlying price dynamics, and identify key trading opportunities.
This indicator is forked from Trendoscope's Recursive Zigzag
The Zigzag Indicator with Trend-based Color Coding and Info Table is a powerful tool for technical analysis, designed to help you identify significant price swings, visualize trends, and analyze pivot points with ease. This advanced indicator offers enhanced functionalities and improved visual representation.
The primary purpose of the Zigzag Indicator is to identify and highlight important price reversals, commonly referred to as pivot points, in a given chart. These pivot points are essential in recognizing trend changes and potential market turning points. With the Zigzag Indicator, you can quickly identify these pivotal moments and gain valuable insights into market dynamics.
One of the standout features of this indicator is the color coding applied to the Zigzag line, which intuitively reflects the trend associated with each pivot point. The color scheme is as follows:
- Green: Indicates an upward trend, representing a bullish movement in the price.
- Lime: Represents a retracement during an upward trend, indicating a temporary pullback before the uptrend resumes.
- Red: Signifies a downward trend, indicating a bearish movement in the price.
- Orange: Represents a retracement during a downward trend, indicating a temporary bounce before the downtrend resumes.
This color coding allows you to easily visualize the prevailing market sentiment and make more informed trading decisions accordingly.
In addition to the visual representation, the Zigzag Indicator also includes an informative table that provides essential details about each pivot point. The table presents the following information for each pivot point:
1. Pivot Value: The price level at which the pivot point occurs.
2. Direction: Indicates whether the pivot point represents an upward or downward trend.
3. Fibo Ratios: Displays the Fibonacci retracement levels between two consecutive pivot points, offering insights into potential support and resistance levels.
The inclusion of this comprehensive info table enables you to analyze pivot points more effectively, understand the underlying price dynamics, and identify key trading opportunities.
發行說明
v2Use Open Close Prices added
You can use open close prices for calculating pivots instead of high/low.
發行說明
V31. DATETIME added to table
2. PIVOT VALUE decimal place fixed
3. Remove unused function
發行說明
v4Minor fix
發行說明
v5typo fixed
開源腳本
本著TradingView的真正精神,此腳本的創建者將其開源,以便交易者可以查看和驗證其功能。向作者致敬!雖然您可以免費使用它,但請記住,重新發佈程式碼必須遵守我們的網站規則。
免責聲明
這些資訊和出版物並不意味著也不構成TradingView提供或認可的金融、投資、交易或其他類型的意見或建議。請在使用條款閱讀更多資訊。
免責聲明
這些資訊和出版物並不意味著也不構成TradingView提供或認可的金融、投資、交易或其他類型的意見或建議。請在使用條款閱讀更多資訊。