INVITE-ONLY SCRIPT
Siege Trade Indicator
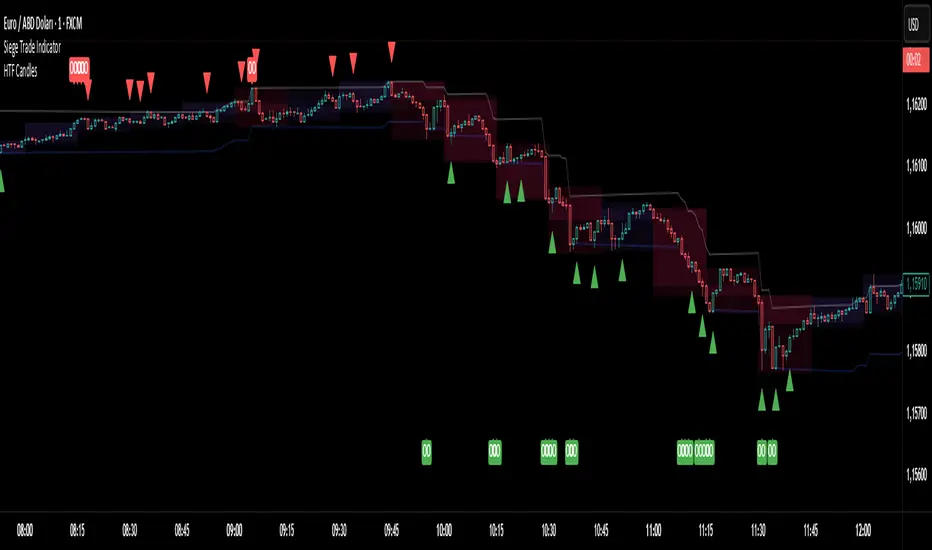
A Comprehensive Indicator Combining Pivot Points, RSI, and Trend Following
This indicator integrates RSI, Pivot Points, and trend-following features into a single view to create a powerful trading strategy. It is an ideal tool for traders who want to both catch trends and identify potential reversals and overbought/oversold regions.
Key Features
How to Use
This indicator is not designed to be a standalone buy/sell signal tool. For the most accurate results, it is recommended to use it in conjunction with different timeframes and your own technical analysis. For instance, when the price approaches a pivot support and the RSI enters the oversold region, it can be considered a potential signal for the start of an uptrend.
This indicator provides strong support for deepening your market analysis and making more informed decisions. For more details...
This indicator integrates RSI, Pivot Points, and trend-following features into a single view to create a powerful trading strategy. It is an ideal tool for traders who want to both catch trends and identify potential reversals and overbought/oversold regions.
Key Features
- RSI (Relative Strength Index): Shows whether the price has reached overbought or oversold territories. Specific RSI levels (e.g., above 70 and below 30) serve as a warning for potential buy/sell signals.
- Pivot Points: Automatically plots support and resistance levels on the chart, calculated on a daily, weekly, or monthly basis. These levels help you identify key points where the price might react.
- Trend Following: Determines the direction of the trend based on price movements and provides clues about its strength. This feature helps reduce the risk of trading against the trend, allowing you to take positions aligned with the current market direction.
How to Use
This indicator is not designed to be a standalone buy/sell signal tool. For the most accurate results, it is recommended to use it in conjunction with different timeframes and your own technical analysis. For instance, when the price approaches a pivot support and the RSI enters the oversold region, it can be considered a potential signal for the start of an uptrend.
This indicator provides strong support for deepening your market analysis and making more informed decisions. For more details...
僅限邀請腳本
只有經作者批准的使用者才能訪問此腳本。您需要申請並獲得使用權限。該權限通常在付款後授予。如欲了解更多詳情,請依照以下作者的說明操作,或直接聯絡ahmedturker。
除非您完全信任其作者並了解腳本的工作原理,否則TradingView不建議您付費或使用腳本。您也可以在我們的社群腳本中找到免費的開源替代方案。
作者的說明
contact:
ahmedturker@gmail.com
https://x.com/ahmedturker45
https://www.youtube.com/@siegetrade
提醒:在請求訪問權限之前,請閱讀僅限邀請腳本指南。
免責聲明
這些資訊和出版物並不意味著也不構成TradingView提供或認可的金融、投資、交易或其他類型的意見或建議。請在使用條款閱讀更多資訊。