INVITE-ONLY SCRIPT
已更新 The WAD Machine - Bitcoin Beats
Hello Hello Hello, and welcome back to Bitcoin Beats!
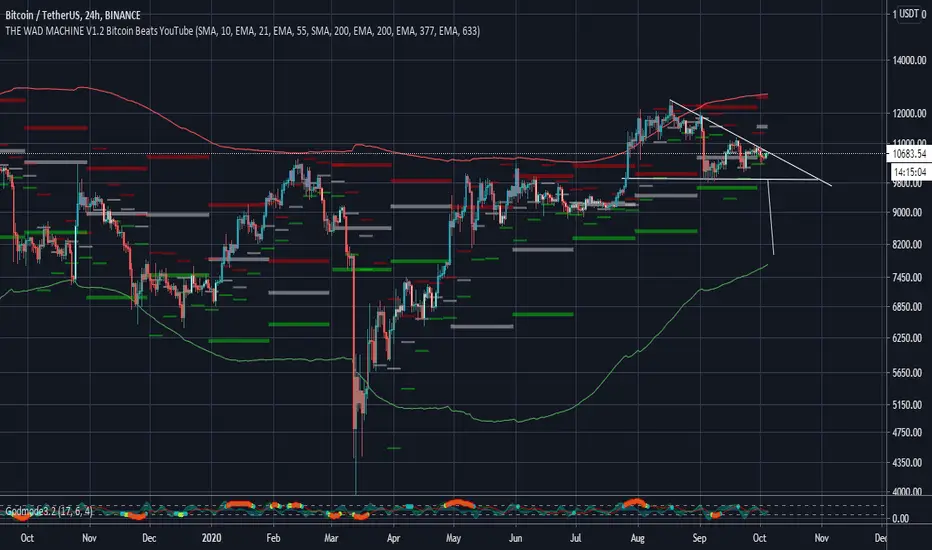
This is a Conglomeration of different scripts into 1 indicator that shows a bunch of different things.
This is not all my own work but also a mixture of features taken from other useful scripts.
I will say in terms of originality, it takes a certain level of skill to put this together and get it working so I'll take the credit for that.
This script does all that is said below:
- Plots fibonacci zones with adjustable days, weeks, months ect.
- Shows lower highs, higher lows, lower lows, lower highs after recognizing candle patterns(note that this is not predictive, just shows what has already happened).
- Plots a Price Action Channel(PAC).
The candles automatically adjust to the PAC to give Buy and Sell signals on most timeframes.
If the candles are blue, it means buy.
If the candles are red, it means sell.
If the candles are grey, you shouldn't be in a trade.
I will not state the profitability of this method but for this section of the indicator, it's designed for entries.
Exits require a more manual approach using your own trading initiative.
Beginner traders should exit when the channel is hit and the candle turns grey again.
However, more advanced traders can try to use the Fibonacci zones and other features to manage their positions.
- Plots general trendlines automatically with customization of the lines and the length they go for.
- Plots major sloping supports and resistances automatically.
PLEASE TRADE AT YOUR OWN RISK.
Cheers, and good bye, from Bitcoin Beats.
發行說明
SCRIPT UPDATE:Have removed the thicker trendlines to make it easier on the eyes for the newcomers.
STRATEGY UPDATE:
THIS SCRIPT WORKS BEST ON THE 15m TIMEFRAME OR ABOVE.
THIS SCRIPT CAN ALSO BE APPLIED TO VARIOUS CHARTS IN OTHER MARKETS. INCLUDING BUT NOT LIMITED TO STOCKS, FOREX AND COMMODITIES.
THIS SCRIPT WORKS BEST WITH HEIKIN ASHI CANDLES.
TRADE AT YOUR OWN RISK!
發行說明
Disabled HH HL LL LH feature by default to avoid confusion for beginners.For those of your messaging me, The moving averages and fibonacci lines are to put your take profits and stoplosses in profit on.
If we break a moving average and the candles turn a certain color, the signal is MUCH stronger!
TRADE SAFE
發行說明
Removed some inputs for beginners and changed the default color of the ema633 from white to purple for ease of use on both dark and white themed charts.發行說明
- Added 10 more moving averages(default is off)- You can turn them all on by pressing the "Show moving averages" button in the settings.
- You can change the EMA/SMA value in the settings.
- You can individually select which EMA's/SMA's you want on the chart by unticking them in the "Style" tab.
Trade safe!
發行說明
Added an auto Support & Resistance drawn on the chart. You can turn this on or off in settings.發行說明
Fixed some EMA options. Just for clarification:
- The blue lines are Auto Support and Resistance.
- The Orange lines are Fibonacci Pivot Points.
You can turn everything off easily in the "Style" tab by simply unticking each line.
Thanks guys, I will continue tweaking but this indicator is pretty much done.
發行說明
- Updated moving averages AGAINCredit goes to GlobalMarketSignals for supplying his code to make it cleaner! He's usually streaming on Tradingview, go check him out!
- Now default half EMA/MA's are on.
- You can individually switch them off if needed.
發行說明
Unfortunately, TV has changed something with a recent update that made this script unusable.DEV NOTES
-Removed auto trendlines.(Please use my other indicator "Blue" for auto trendlines)
- Removed auto Fibonacci retracement lines.(replaced with a better feature)
- Added Custom moving averages with EMA/SMA Options. Default settings are more in tune with the average trader.(10,21,55,200,200,377,633)
- Added Daily/Weekly/Monthly auto Support/Resistance. These are used for setting takeprofits are potential pivot points for the future.
Unfortunately due to Pinescript's memory, I can't add anymore features. However, I have other indicators that have more features if needed.
This will be it for the WAD unless I need to fix it again.
發行說明
Set the default settings of most things to OFF. You can go into the settings and turn each feature on at your own leisure.Added the option to remove the PAC(Price Action Channel) for a less convoluted experience.
發行說明
Added VWATR, A range calculated using traditional ATR methods but with VWMAs. You can tick this on or off (default is off) in the indicator settings.This can be used to determine absolute tops and bottoms and reversal points after $1000+ moves.
Enjoy!
僅限邀請腳本
僅作者批准的使用者才能訪問此腳本。您需要申請並獲得使用許可,通常需在付款後才能取得。更多詳情,請依照作者以下的指示操作,或直接聯絡Hamilton_Gilpin。
TradingView不建議在未完全信任作者並了解其運作方式的情況下購買或使用腳本。您也可以在我們的社群腳本中找到免費的開源替代方案。
作者的說明
免責聲明
這些資訊和出版物並非旨在提供,也不構成TradingView提供或認可的任何形式的財務、投資、交易或其他類型的建議或推薦。請閱讀使用條款以了解更多資訊。
僅限邀請腳本
僅作者批准的使用者才能訪問此腳本。您需要申請並獲得使用許可,通常需在付款後才能取得。更多詳情,請依照作者以下的指示操作,或直接聯絡Hamilton_Gilpin。
TradingView不建議在未完全信任作者並了解其運作方式的情況下購買或使用腳本。您也可以在我們的社群腳本中找到免費的開源替代方案。
作者的說明
免責聲明
這些資訊和出版物並非旨在提供,也不構成TradingView提供或認可的任何形式的財務、投資、交易或其他類型的建議或推薦。請閱讀使用條款以了解更多資訊。