OPEN-SOURCE SCRIPT
Correlative Move Indicator
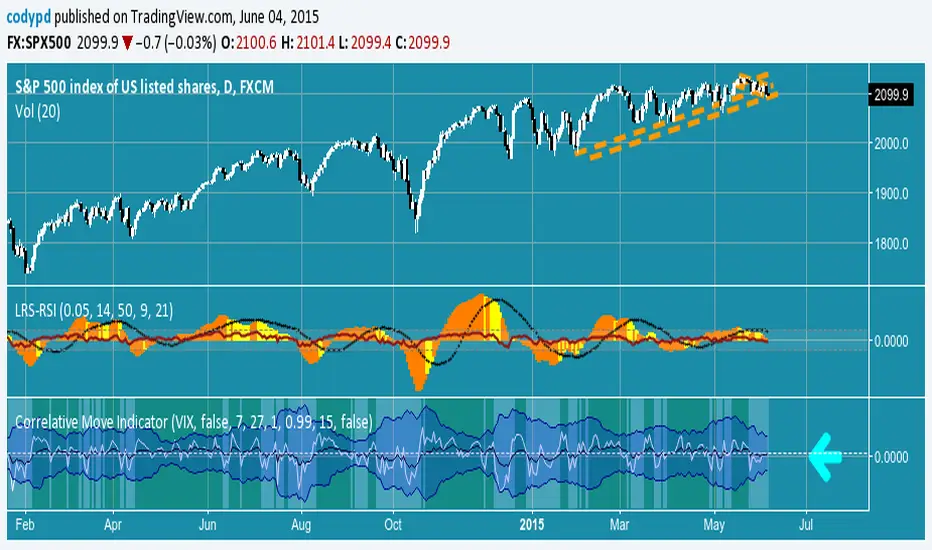
EDIT: When loading this indicator it uses a default symbol for comparison of SPX. On Tradingview SPX is a Daily price (unless you buy real time) so you will see "Loading ..." and never see data. Move out to a daily time frame -or- switch the symbol to something available intraday. /EDIT
Correlates the movement of the price you are graphing to the price of someting else that you pick (default is SPX, see EDIT above)
Comments in code explain what I did. If correlations are too tight for CC to show anything but a flat line try this.
Please comment / improve.
=====================
// A simple indicator that looks complex (impress your friends)
// Provides rate of change in the propensity of something
// to move in correlation with whatever you are graphing.
// Inputs are:
// "Compared symbol" - standard Trading View symbol input. You can input ratios & formulas if you like; Defaults to SPX
// "Invert?" - by default the indicator shows the item you have charted as numerator and the "Compared symbol"
// the denominator. So if you graphed "UVXY" and open this indicator with default compared symbol "SPX" then
// the base relationship is UVXY/SPX. Click the box if you want SPX/UVXY (for example) instead.
// "Fast EMA Period" - the period for the fast EMA (white line). default = 7
// "Slow EMA Period" - the period for the slow EMA (black line). default = 27. Important: the bakground color of the indicator
// changes based on this EMA hitting threshold values below.
// "+ threshold" - > threshold for green background. default = 1.0
// "- threshold" - < threshold for red background. default = 0.99
// "BBand Period" - number of periods back for BBand (1 std deviation) calculation. default = 15
// Does not measure correlation per se - it measures change in that correlation.
// If two things do not correlate well in the first place then you will see a lot of noise
// and I wish you much luck in interpreting it.
// However, if two things do correlate well (like VXX and VIX) then this will help you detect
// circumstances where that correlation is unstable. Such instability can signal change in direction.
// I developed it to track real time changes in contango / backwardation in various VIX futures instruments which I trade.
// Tip - always try invert - sometimes the correlation changes become clearer. That can be because the threshold bias
// towards "+" with the defaults here, so think about what the "logical" relationship is and adjust the thresholds, or invert,
// or do both. Just remember - the indicator is below the item you are charting, so the default "source"/"compared"
// relationship is intuitive as you look at the screen. Volatility traders, however, will find "invert" useful with default
// thresholds signalling "green" for contango and "red" for backwardation.
// Short and long ema trends added for smoothing and trend change indications.
// Background color changes to green when correlation changing "positively" and red when "negatively" and white when near 1.
// Think of the value "1" as representing the base "1 to 1" correlation between two things. That doesn't mean same price -
// it means same rate and direction in change in price.
// 1 std deviation is used to build a basic Bollinger Band in blue. The number of periods for calculating that is an input.
// You may find a change in correlation signal outside a Bollinger Band signals a direction change. TV alerts can be
// set for such events.
開源腳本
本著TradingView的真正精神,此腳本的創建者將其開源,以便交易者可以查看和驗證其功能。向作者致敬!雖然您可以免費使用它,但請記住,重新發佈程式碼必須遵守我們的網站規則。
免責聲明
這些資訊和出版物並不意味著也不構成TradingView提供或認可的金融、投資、交易或其他類型的意見或建議。請在使用條款閱讀更多資訊。
免責聲明
這些資訊和出版物並不意味著也不構成TradingView提供或認可的金融、投資、交易或其他類型的意見或建議。請在使用條款閱讀更多資訊。