PROTECTED SOURCE SCRIPT
已更新 The Directional Cross Strategy
A simple chart-based strategy, which capitalizes on trend change.
Based on Azeez Mustapha's article featured in Stocks & Commodities Oct 2021 issue.
This indicator consists of three tools: a simple moving average (SMA), price envelopes, and Bollinger Bands.
Please note that this strategy only works in trending markets.
What is a trending market?
A trending market is one that is ascending with higher highs and higher lows or descending with lower highs and lower lows.
So, when the market is ranging it's not a good fit for this strategy. It is therefore advisable for the trader to stay out of the market when consolidation is noticed.
Usage of other tools in combination with this one is recommended to determine the market conditions.
Ok, so how to use this indicator:
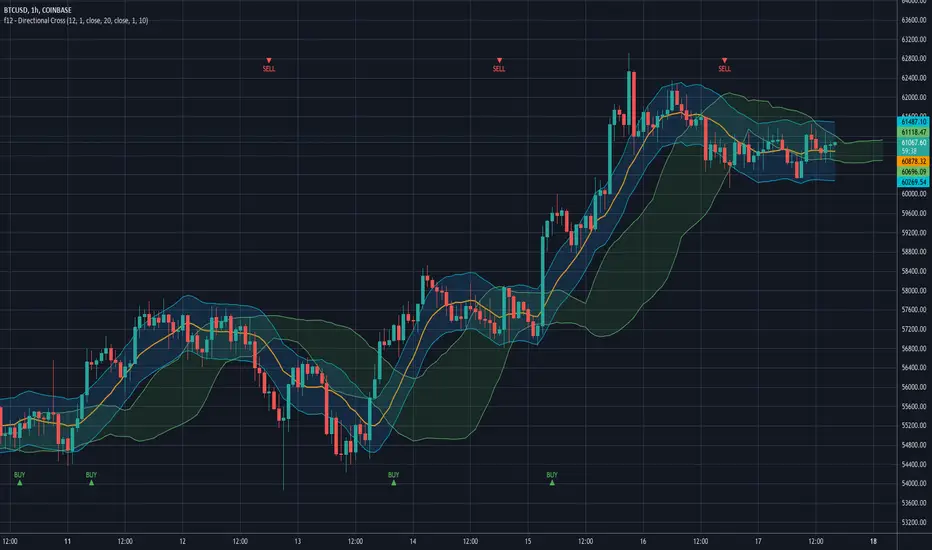
The combination of the indicators used in this strategy displays BUY and SELL alerts.
When the lower line of the envelope on the chart would cross over the lower band of the Bollinger Bands, a BUY alert is displayed.
When the upper line of the envelope on the chart would cross down the upper band of the Bollinger Bands, a SELL alert is displayed.
As always, proper risk management should be followed.
Based on Azeez Mustapha's article featured in Stocks & Commodities Oct 2021 issue.
This indicator consists of three tools: a simple moving average (SMA), price envelopes, and Bollinger Bands.
Please note that this strategy only works in trending markets.
What is a trending market?
A trending market is one that is ascending with higher highs and higher lows or descending with lower highs and lower lows.
So, when the market is ranging it's not a good fit for this strategy. It is therefore advisable for the trader to stay out of the market when consolidation is noticed.
Usage of other tools in combination with this one is recommended to determine the market conditions.
Ok, so how to use this indicator:
The combination of the indicators used in this strategy displays BUY and SELL alerts.
When the lower line of the envelope on the chart would cross over the lower band of the Bollinger Bands, a BUY alert is displayed.
When the upper line of the envelope on the chart would cross down the upper band of the Bollinger Bands, a SELL alert is displayed.
As always, proper risk management should be followed.
發行說明
Buy/Sell signals now coordinate with the BB offset.受保護腳本
此腳本以閉源形式發佈。 不過,您可以自由使用,沒有任何限制 — 點擊此處了解更多。
免責聲明
這些資訊和出版物並非旨在提供,也不構成TradingView提供或認可的任何形式的財務、投資、交易或其他類型的建議或推薦。請閱讀使用條款以了解更多資訊。
免責聲明
這些資訊和出版物並非旨在提供,也不構成TradingView提供或認可的任何形式的財務、投資、交易或其他類型的建議或推薦。請閱讀使用條款以了解更多資訊。